春のパン祭りシールの点数文字認識処理は、これ以上調整はなしにしようと思っていましたが、もう少しがんばってみます。
方針
前回の結果で、問題点の1つは
- シールの白抜き部分(点数文字が含まれる)の間隔が小さく、輪郭がつながってしまう
ということだったかと。
画像の2値化処理のところに戻って、うまく調整できないかと考えました。
2値化の調整
今作っている処理では、色相(Hue)、彩度(Saturation)を使って、点数シールのピンク領域を前景領域とした2値化画像を作っています。
今まで使った7つの画像と、前回うまくいかなかった画像でいくつか試してみます。
一旦まずはライブラリ等の下準備を。
import cv2
import numpy as np
%matplotlib inline
from matplotlib import pyplot as plt
import math
import copy
import random
img1 = cv2.imread('harupan_190428_1.jpg')
img2 = cv2.imread('harupan_190428_2.jpg')
img3 = cv2.imread('harupan_200317_1.jpg')
img4 = cv2.imread('harupan_210227_2.jpg')
img5 = cv2.imread('harupan_210402_1.jpg')
img6 = cv2.imread('harupan_210402_2.jpg')
img7 = cv2.imread('harupan_210414_1.jpg')
img8 = cv2.imread('harupan_220330_1.jpg')
img9 = cv2.imread('harupan_220330_2.jpg')
今まで使っていた処理から、2値化の部分だけ抜き出します。
また、彩度情報も2値化に使用していますが、これも調整が必要かと思い、閾値を設定できるようにしました。
def harupan_binarize(image, res_th=800, sat_th=100):
    h, w, chs = image.shape
    if h > res_th or w > res_th:
        k = float(res_th)/h if w > h else float(res_th)/w
    else:
        k = 1.0
    img = cv2.resize(image, None, fx=k, fy=k, interpolation=cv2.INTER_AREA)
    hsv = cv2.cvtColor(img, cv2.COLOR_BGR2HSV)
    # Convert hue value (rotation, mask by saturation)
    hsv[:,:,0] = np.where(hsv[:,:,0] < 50, hsv[:,:,0]+180, hsv[:,:,0])
    hsv[:,:,0] = np.where(hsv[:,:,1] < sat_th, 0, hsv[:,:,0])
    # Thresholding with cv2.inRange()
    binary_img = cv2.inRange(hsv[:,:,0], 135, 190)
    return binary_img
試したこと
- 膨張処理の実施
2値化した後、膨張処理によってピンク領域を広げる→点数文字領域を縮小する、ということによって、輪郭どうしがつながるのを抑制する - 彩度情報でピンク領域かどうかのふるい分けをしているが、この条件を緩和してピンク領域を増やすことで、膨張処理と似た効果を得る
ということを試します。
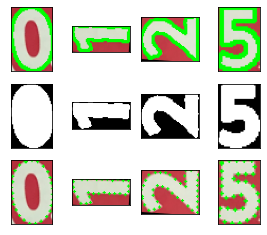
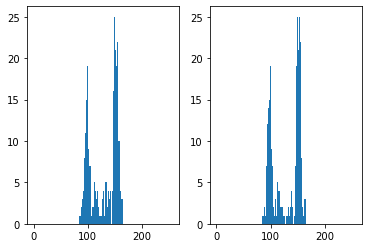
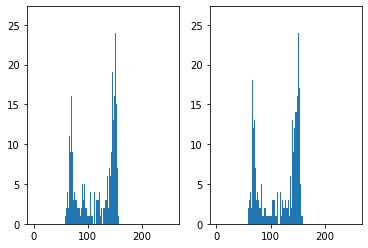
各画像5つを並べていますが、
となっています。
imgs = [img1, img2, img3, img4, img5, img6, img7, img8, img9]
binimgs = []

for img in imgs:
    binimg = harupan_binarize(img)
    binimg_sat = harupan_binarize(img, sat_th=50)
    kernel = np.ones((3,3), np.uint8)
    binimg_dil = cv2.dilate(binimg, kernel, iterations=1)
    binimg_sat_dil = cv2.dilate(binimg_sat, kernel, iterations=1)
    plt.figure(figsize=(25.6,9.6), dpi=100)
    plt.subplot(1,5,1), plt.imshow(cv2.cvtColor(img, cv2.COLOR_BGR2RGB), interpolation='none'), plt.xticks([]), plt.yticks([])
    plt.subplot(1,5,2), plt.imshow(binimg, cmap='gray', interpolation='none'), plt.xticks([]), plt.yticks([])
    plt.subplot(1,5,3), plt.imshow(binimg_sat, cmap='gray', interpolation='none'), plt.xticks([]), plt.yticks([])
    plt.subplot(1,5,4), plt.imshow(binimg_dil, cmap='gray', interpolation='none'), plt.xticks([]), plt.yticks([])
    plt.subplot(1,5,5), plt.imshow(binimg_sat_dil, cmap='gray', interpolation='none'), plt.xticks([]), plt.yticks([])
    plt.show()
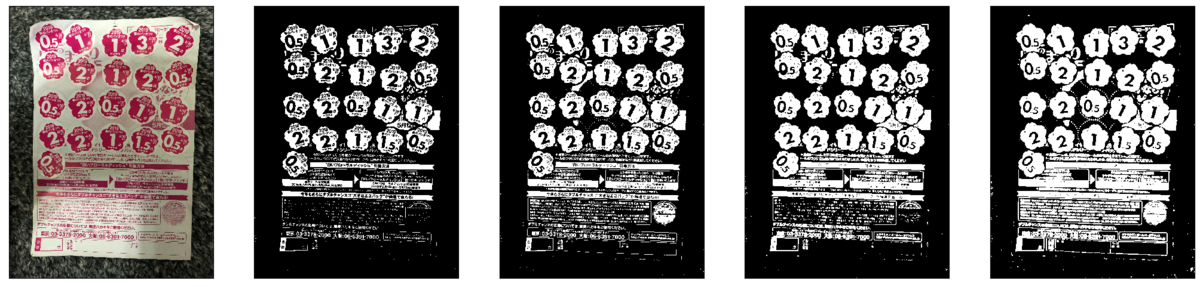
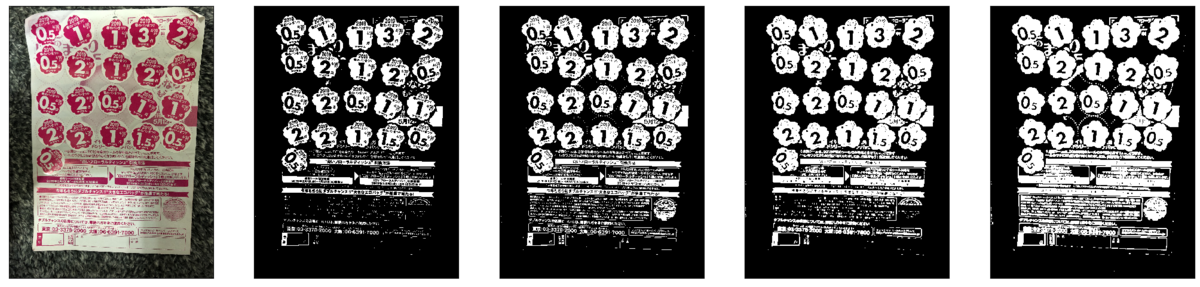
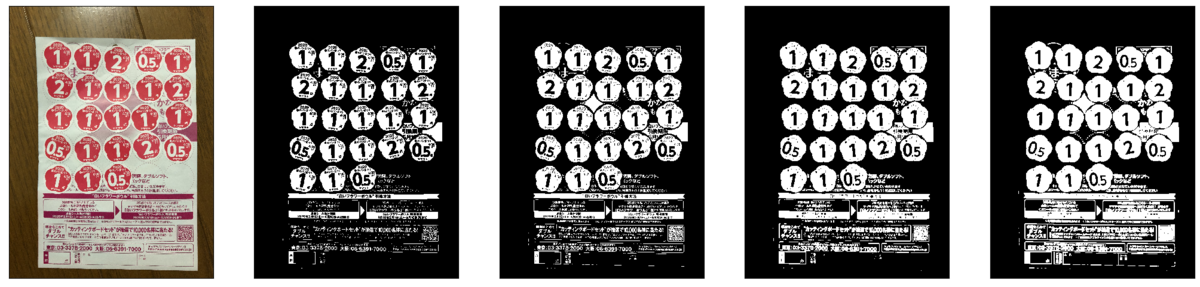
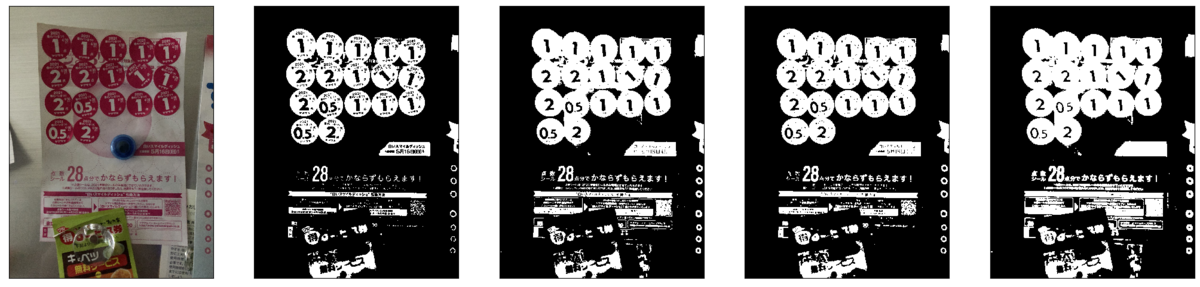
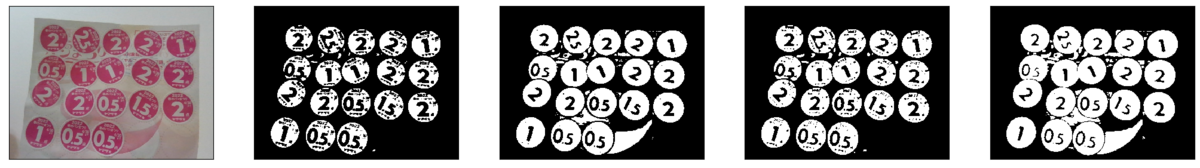
ここでは、plt.imshow()のinterpolation引数で'none'を指定してみました。これによって、アンチエイリアス処理等入らない、生のピクセル配列が見やすくなりました。
https://bftnagoya.hateblo.jp/entry/2021/04/06/164423
plt.figure()でのグラフサイズ設定にもよって見た目が変わったので、実はこれもピクセル配列がそのまま見えているわけではないかも。
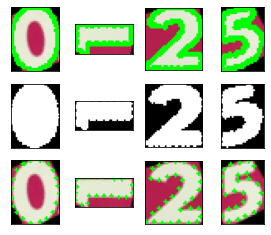
処理の変更で、2値化の結果にそれなりに違いは出たかな。
- 彩度閾値の変更、膨張処理のいずれでもシール内部の黒領域が減っている。
- 画像により、どちらのほうが効果が高いか異なる。
- 今までの画像では、膨張処理のほうが効いている。
- 前回の低解像度画像では、彩度閾値変更のほうが効いている。
- 両方適用すると点数文字が消えそうになっている…やり過ぎか。
今までの画像では特に文字認識に問題はなかったので、低解像度画像で効果のありそうな、彩度閾値変更のほうを試してみたいと思います。
スクリプト変更
シール点数計算スクリプト(harupan.py)で、detect_candidate_contours()関数(画像から点数輪郭を取得する)を以下のように変更します。
######################################################
# Detecting contours
######################################################
def reduce_resolution(img, res_th=800):
    h, w, chs = img.shape
    if h > res_th or w > res_th:
        k = float(res_th)/h if w > h else float(res_th)/w
    else:
        k = 1.0
    rtn_img = cv2.resize(img, None, fx=k, fy=k, interpolation=cv2.INTER_AREA)
    return rtn_img

def harupan_binarize(img, sat_th=100):
    hsv = cv2.cvtColor(img, cv2.COLOR_BGR2HSV)
    # Convert hue value (rotation, mask by saturation)
    hsv[:,:,0] = np.where(hsv[:,:,0] < 50, hsv[:,:,0]+180, hsv[:,:,0])
    hsv[:,:,0] = np.where(hsv[:,:,1] < sat_th, 0, hsv[:,:,0])
    # Thresholding with cv2.inRange()
    binary_img = cv2.inRange(hsv[:,:,0], 135, 190)
    return binary_img

def detect_candidate_contours(image, res_th=800, sat_th=100):
    img = reduce_resolution(image, res_th)
    binimg = harupan_binarize(img, sat_th)
    # Retrieve all points on the contours (cv2.CHAIN_APPROX_NONE)
    contours, hierarchy = cv2.findContours(binimg, cv2.RETR_TREE, cv2.CHAIN_APPROX_NONE)
    indices0 = [i for i,hier in enumerate(hierarchy[0,:,:]) if hier[3] == -1]
    indices1 = [i for i,hier in enumerate(hierarchy[0,:,:]) if hier[3] in indices0]
    contours1 = [contours[i] for i in indices1]
    contours1_filtered = [ctr for ctr in contours1 if cv2.contourArea(ctr) > float(res_th)*float(res_th)/4000]
    return contours1_filtered, img
変更したスクリプトを読み込んでおきます。
from harupan_data.harupan import *
テンプレート再作成、SVM再学習
輪郭検出処理も変わったので、テンプレートの作成とSVM学習を改めてやり直します。
輪郭検出
まずは各画像で輪郭検出をしておきます。
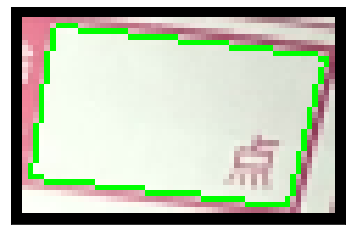
resized_imgs = []
ctrs_all = []
original_img_idx = []
subctrs_all = []
subimgs_all = []

plt.figure(figsize=(25.6, 9.6), dpi=200)
for i,img in enumerate(imgs):
    ctrs, im = detect_candidate_contours(img, sat_th=50)
    resized_imgs += [im]
    ctrs_all += [ctrs]

    for ctr in ctrs:
        original_img_idx += [i]
        subimg, subctr = create_contour_area_image(im, ctr)
        subctrs_all += [subctr]
        subimgs_all += [subimg]

    ctrs_img = cv2.drawContours(im.copy(), ctrs, -1, (0,255,0), 3)
    plt.subplot(2,5,1+i), plt.imshow(cv2.cvtColor(ctrs_img, cv2.COLOR_BGR2RGB)), plt.xticks([]), plt.yticks([])
plt.show()
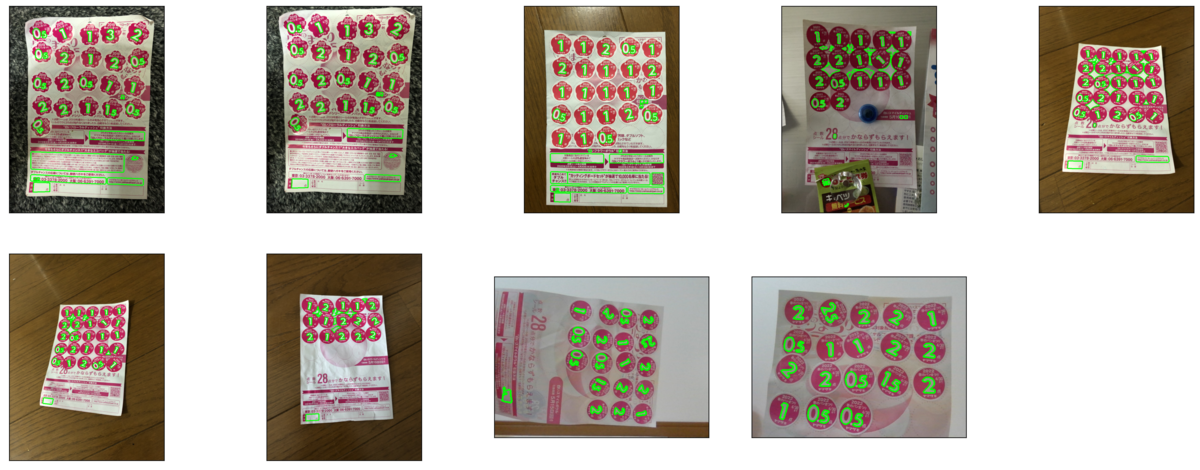
ひとまず全画像必要な点数文字の輪郭は取得できたよう。
データセットも用意しておきます。
ctr_datasets_all = [contour_dataset(ctr) for ctr in subctrs_all]
テンプレート選択、正解ラベル作成
今までと同様、1つ目、3つ目、5つ目の画像から点数文字テンプレートを選びます。
また、学習用データ向けに、正解ラベルも用意します。
from ipywidgets import interact, fixed

def draw_contour(img, ctrs, idx):
    img_with_ctr = cv2.drawContours(img.copy(), [ctrs[idx]], -1, (0,255,0), 2)
    plt.figure(figsize=(6.4,4.8), dpi=100)
    plt.imshow(cv2.cvtColor(img_with_ctr, cv2.COLOR_BGR2RGB)), plt.xticks([]), plt.yticks([])
    plt.show()

def draw_contour_interact(i_img, idx):
    draw_contour(resized_imgs[i_img], ctrs_all[i_img], idx)

interact(draw_contour_interact, i_img=fixed(0), idx=(0, len(ctrs_all[0])-1));
labels1 = [
    -1, -1, -1, -1, -1,
    -1, 5, 0, 5, 1,
    5, 0, 2, 1, 2,
    -1, 1, 1, 5, 0,
    2, 5, 0, 2, 5,
    0, 1, 2, 5, 0,
    1, 3, 2, 1, 5,
    0
]

template_idx1 = {0:11, 1:13, 2:20, 3:31, 5:8}
interact(draw_contour_interact, i_img=fixed(1), idx=(0, len(ctrs_all[1])-1));
labels2 = [
    -1, -1, -1, -1, 5,
    0, 5, 1, 5, 0,
    2, 1, 2, -1, -1,
    1, 1, 5, 0, 2,
    5, 0, 2, 5, 0,
    1, 2, 5, 0, 1,
    2, 3, 1, 5, 0
]
interact(draw_contour_interact, i_img=fixed(2), idx=(0, len(ctrs_all[2])-1));
labels3 = [
    -1, -1, -1, -1, -1,
    -1, -1, -1, -1, -1,
    1, 1, 5, 0, 1,
    1, 5, 0, 5, 0,
    2, -1, -1, -1, 1,
    1, 1, 1, 1, 1,
    1, 2, 1, 2, 1,
    2, 5, 0, 1, 1
]

template_idx3 = {0:13, 1:14, 2:31, 5:18}
interact(draw_contour_interact, i_img=fixed(3), idx=(0, len(ctrs_all[3])-1));
labels4 = [
    -1, -1, -1, -1, -1,
    5, 0, 2, 5, 0,
    1, 1, 2, 1, -1,
    -1, 1, -1, 1, 1,
    2, 2, -1, -1, -1,
    -1, -1, -1, 1, 1,
    1, 1, -1, 1, -1
]
interact(draw_contour_interact, i_img=fixed(4), idx=(0, len(ctrs_all[4])-1));
labels5 = [
    -1, -1, 0, 1, 5,
    2, -1, 1, 1, -1,
    5, 1, 0, -1, 5,
    2, 0, 1, 5, 0,
    1, 1, 2, 1, 1,
    1, 1, 2, 2, -1,
    -1, -1, -1, 1, 1,
    1, 1, -1, 1
]

template_idx5 = {0:12, 1:11, 2:5, 5:10}
interact(draw_contour_interact, i_img=fixed(5), idx=(0, len(ctrs_all[5])-1));
labels6 = [
    -1, 0, 1, 5, 2,
    -1, 1, 1, 5, 1,
    0, 5, 0, 2, 1,
    5, 0, 2, 1, 1,
    2, 2, -1, 1, -1,
    -1, 1, 1, 1, 1,
    1, 1, 1, 1
]
interact(draw_contour_interact, i_img=fixed(6), idx=(0, len(ctrs_all[6])-1));
labels7 = [
    -1, 1, 2, 2, 2,
    2, -1, -1, 1, 2,
    2, 2, 1, -1, -1,
    -1, 2, 1, 2, 1,
    1, -1
]
PCカメラ画像でも確認します。
interact(draw_contour_interact, i_img=fixed(7), idx=(0, len(ctrs_all[7])-1));
labels8 = [
    1, 2, 2, 2, 2,
    5, 1, 2, 5, 5,
    0, 0, 5, 2, 1,
    1, 2, 5, 0, 2,
    5, 0, 2, 1, -1
]
interact(draw_contour_interact, i_img=fixed(8), idx=(0, len(ctrs_all[8])-1));
labels9 = [
    5, 0, 5, 0, 1,
    2, 5, 1, 5, 0,
    2, 2, 2, 2, 1,
    1, 5, 0, 1, 2,
    2, 5, 2, 2
]
labels_all = labels1 + labels2 + labels3 + labels4 + labels5 + labels6 + labels7 + labels8 + labels9
テンプレート確認
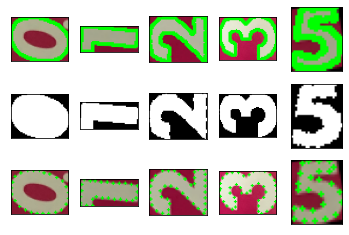
subimgs1 = []
subctrs1 = []
binimgs1 = []
subctrs1_selected_pts = []
for i,(num, idx) in enumerate(template_idx1.items()):
    img, ctr = create_contour_area_image(resized_imgs[0], ctrs_all[0][idx])
    binimg, M, ctr2 = create_upright_solid_contour(ctr)
    img2 = cv2.warpAffine(img.copy(), M, (binimg.shape[1], binimg.shape[0]))
    subimgs1 += [img2]
    subctrs1 += [ctr2]
    binimgs1 += [binimg]
    ctr_selected_pts = [j for j in range(ctr2.shape[0]) if j % 5 == 0]
    if i != 0:
        subctrs1_selected_pts += [ctr_selected_pts]
    ctr_img = cv2.drawContours(img2.copy(), [ctr2], -1, (0,255,0), 2)
    pts_img = img2.copy()
    for p in ctr_selected_pts:
        pts_img = cv2.drawMarker(pts_img, ctr2[p,0,:], (0,255,0), markerType=cv2.MARKER_CROSS, markerSize=3)
    plt.subplot(3,5,1+i), plt.imshow(cv2.cvtColor(ctr_img, cv2.COLOR_BGR2RGB)), plt.xticks([]), plt.yticks([])
    plt.subplot(3,5,6+i), plt.imshow(binimg,cmap='gray'), plt.xticks([]), plt.yticks([])
    plt.subplot(3,5,11+i), plt.imshow(cv2.cvtColor(pts_img, cv2.COLOR_BGR2RGB), cmap='gray'), plt.xticks([]), plt.yticks([])
plt.show()
subimgs3 = []
subctrs3 = []
binimgs3 = []
subctrs3_selected_pts = []
for i,(num, idx) in enumerate(template_idx3.items()):
    img, ctr = create_contour_area_image(resized_imgs[2], ctrs_all[2][idx])
    binimg, M, ctr2 = create_upright_solid_contour(ctr)
    img2 = cv2.warpAffine(img.copy(), M, (binimg.shape[1], binimg.shape[0]))
    subimgs3 += [img2]
    subctrs3 += [ctr2]
    binimgs3 += [binimg]
    ctr_selected_pts = [j for j in range(ctr2.shape[0]) if j % 5 == 0]
    if i != 0:
        subctrs3_selected_pts += [ctr_selected_pts]
    ctr_img = cv2.drawContours(img2.copy(), [ctr2], -1, (0,255,0), 2)
    pts_img = img2.copy()
    for p in ctr_selected_pts:
        pts_img = cv2.drawMarker(pts_img, ctr2[p,0,:], (0,255,0), markerType=cv2.MARKER_CROSS, markerSize=3)
    plt.subplot(3,5,1+i), plt.imshow(cv2.cvtColor(ctr_img, cv2.COLOR_BGR2RGB)), plt.xticks([]), plt.yticks([])
    plt.subplot(3,5,6+i), plt.imshow(binimg,cmap='gray'), plt.xticks([]), plt.yticks([])
    plt.subplot(3,5,11+i), plt.imshow(cv2.cvtColor(pts_img, cv2.COLOR_BGR2RGB), cmap='gray'), plt.xticks([]), plt.yticks([])
plt.show()

subimgs3.insert(3, subimgs1[3])
subctrs3.insert(3, subctrs1[3])
binimgs3.insert(3, binimgs1[3])
subctrs3_selected_pts.insert(2, subctrs1_selected_pts[2])
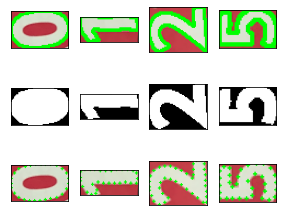
subimgs5 = []
subctrs5 = []
binimgs5 = []
subctrs5_selected_pts = []
for i,(num, idx) in enumerate(template_idx5.items()):
    img, ctr = create_contour_area_image(resized_imgs[4], ctrs_all[4][idx])
    binimg, M, ctr2 = create_upright_solid_contour(ctr)
    img2 = cv2.warpAffine(img.copy(), M, (binimg.shape[1], binimg.shape[0]))
    subimgs5 += [img2]
    subctrs5 += [ctr2]
    binimgs5 += [binimg]
    ctr_selected_pts = [j for j in range(ctr2.shape[0]) if j % 5 == 0]
    if i != 0:
        subctrs5_selected_pts += [ctr_selected_pts]
    ctr_img = cv2.drawContours(img2.copy(), [ctr2], -1, (0,255,0), 2)
    pts_img = img2.copy()
    for p in ctr_selected_pts:
        pts_img = cv2.drawMarker(pts_img, ctr2[p,0,:], (0,255,0), markerType=cv2.MARKER_CROSS, markerSize=3)
    plt.subplot(3,5,1+i), plt.imshow(cv2.cvtColor(ctr_img, cv2.COLOR_BGR2RGB)), plt.xticks([]), plt.yticks([])
    plt.subplot(3,5,6+i), plt.imshow(binimg,cmap='gray'), plt.xticks([]), plt.yticks([])
    plt.subplot(3,5,11+i), plt.imshow(cv2.cvtColor(pts_img, cv2.COLOR_BGR2RGB), cmap='gray'), plt.xticks([]), plt.yticks([])
plt.show()

subimgs5.insert(3, subimgs1[3])
subctrs5.insert(3, subctrs1[3])
binimgs5.insert(3, binimgs1[3])
subctrs5_selected_pts.insert(2, subctrs1_selected_pts[2])
テンプレートデータセットの作成
# Prepare template data for "0"
templates1 = [template_dataset(subctrs1[0], 0)]
templates3 = [template_dataset(subctrs3[0], 0)]
templates5 = [template_dataset(subctrs5[0], 0)]
# Prepare template data for other numbers
numbers = [1, 2, 3, 5]
for i,num in enumerate(numbers):
    templates1 += [template_dataset(subctrs1[i+1], num, subctrs1_selected_pts[i])]
    templates3 += [template_dataset(subctrs3[i+1], num, subctrs3_selected_pts[i])]
    templates5 += [template_dataset(subctrs5[i+1], num, subctrs5_selected_pts[i])]
一致度計算
templates_sel = [1,1,3,5,5,5,5,5,5]
def select_template(i):
    img_idx = original_img_idx[i]
    if templates_sel[img_idx] == 1:
        return templates1
    elif templates_sel[img_idx] == 3:
        return templates3
    elif templates_sel[img_idx] == 5:
        return templates5
    else:
        return templates1

similarities_all = []
converted_imgs_all = []
print('  Contour No. ', end='')
for i,target_ctr in enumerate(ctr_datasets_all):
    templates = select_template(i)
    print(i, ' ', end='')
    sims, imgs = get_similarities(target_ctr, templates)
    similarities_all += [sims]
    converted_imgs_all += [imgs]
Contour No. 0 1 2 3 4 5 6 7 8 9 10 11 12 13 14 15 16 17 18 19 20 21 22 23 24 25 26 27 28 29 30 31 32 33 34 35 36 37 38 39 40 41 42 43 44 45 46 47 48 49 50 51 52 53 54 55 56 57 58 59 60 61 62 63 64 65 66 67 68 69 70 71 72 73 74 75 76 77 78 79 80 81 82 83 84 85 86 87 88 89 90 91 92 93 94 95 96 97 98 99 100 101 102 103 104 105 106 107 108 109 110 111 112 113 114 115 116 117 118 119 120 121 122 123 124 125 126 127 128 129 130 131 132 133 134 135 136 137 138 139 140 141 142 143 144 145 146 147 148 149 150 151 152 153 154 155 156 157 158 159 160 161 162 163 164 165 166 167 168 169 170 171 172 173 174 175 176 177 178 179 180 181 182 183 184 185 186 187 188 189 190 191 192 193 194 195 196 197 198 199 200 201 202 203 204 205 206 207 208 209 210 211 212 213 214 215 216 217 218 219 220 221 222 223 224 225 226 227 228 229 230 231 232 233 234 235 236 237 238 239 240 241 242 243 244 245 246 247 248 249 250 251 252 253 254 255 256 257 258 259 260 261 262 263 264 265 266 267 268 269 270 271 272 273 274 275 276 277 278 279 280 281 282 283 284 285 286 287 288 289
SVM学習
前にまとめた関連処理を改めて示します。
def get_random_sample(data_in, labels_in, selected_labels, n_samples, seed=None):
    random.seed(seed)
    data_rtn = []
    labels_rtn = []
    for lab in selected_labels:
        samples = [d for i,d in enumerate(data_in) if labels_in[i]==lab]
        n = min(n_samples, len(samples))
        data_rtn += random.sample(samples, n)
        labels_rtn += [lab] * n
    return data_rtn, labels_rtn

def prepare_svm(train_data, train_labels):
    svm = cv2.ml.SVM_create()
    svm.setKernel(cv2.ml.SVM_LINEAR)
    svm.setType(cv2.ml.SVM_C_SVC)
    svm.setC(100)
    svm.setGamma(1)
    svm.train(np.array(train_data, 'float32'), cv2.ml.ROW_SAMPLE, np.array(train_labels))
    return svm

def print_stat(svm_results, svm_labels):
    stats = {k:{k2:0 for k2 in [-1, 0, 1, 2, 3, 5]} for k in [-1, 0, 1, 2, 3, 5]}
    for res, lab in zip(svm_results[1], svm_labels):
        stats[lab][int(res[0])] += 1
    for k,v in stats.items():
        print('label {:>2}'.format(k), ': {', end='')
        for k2,v2 in v.items():
            print('{}: {:>2}, '.format(k2,v2), end='')
        print('}')

def print_similarity_vector(sim, end=''):
    print('[',end='')
    for s in sim: print('{:.3f}, '.format(s), end='')
    print(']', end=end)
svm_inputs = copy.deepcopy(similarities_all)
svm_labels = copy.deepcopy(labels_all)

train_data, train_labels = get_random_sample(svm_inputs, svm_labels, [-1,0,1,2,3,5], 20, seed=1)
svm = prepare_svm(train_data, train_labels)
SVM推論実施
result = svm.predict(np.array(svm_inputs, 'float32'))
print_stat(result, svm_labels)
label -1 : {-1: 55, 0:  4, 1:  5, 2:  0, 3:  0, 5:  1, }
label  0 : {-1:  2, 0: 34, 1:  0, 2:  0, 3:  0, 5:  0, }
label  1 : {-1:  1, 0:  0, 1: 86, 2:  1, 3:  0, 5:  0, }
label  2 : {-1:  0, 0:  0, 1:  0, 2: 57, 3:  0, 5:  0, }
label  3 : {-1:  0, 0:  0, 1:  0, 2:  0, 3:  2, 5:  0, }
label  5 : {-1:  2, 0:  0, 1:  0, 2:  0, 3:  0, 5: 40, }
ちょこちょこ失敗してる…
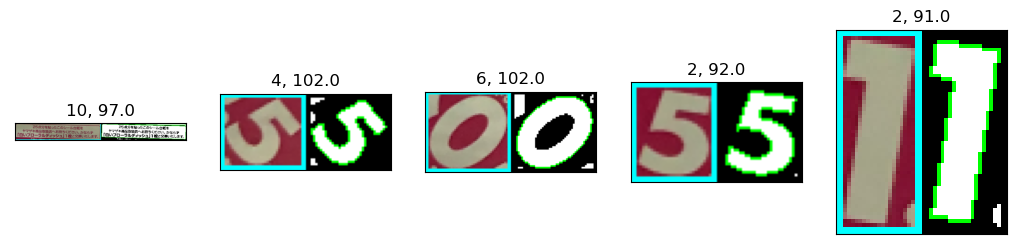
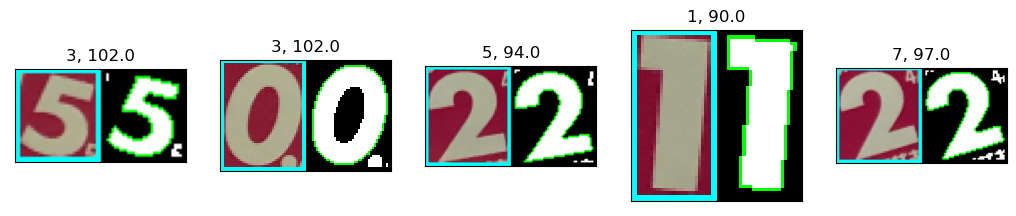
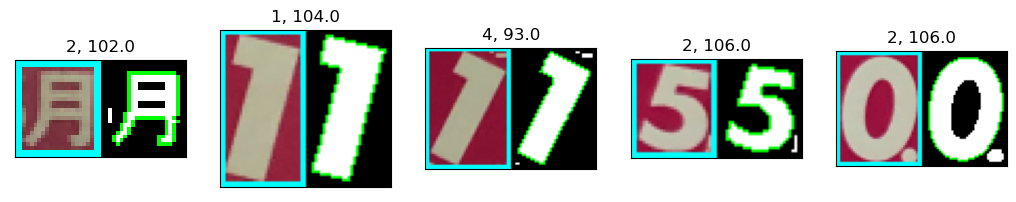
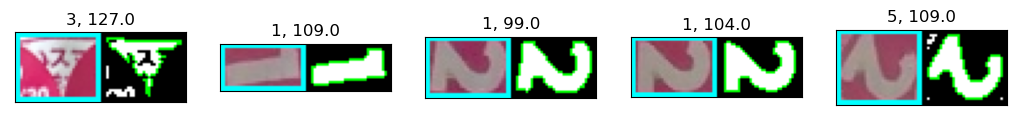
どこで失敗したか確認します。
subimgs = copy.deepcopy(subimgs_all)
subctrs = copy.deepcopy(subctrs_all)

for i,(sims,lab,res,img,ctr) in enumerate(zip(svm_inputs, svm_labels, result[1], subimgs, subctrs)):
    if lab != res[0]:
        print('No.', i)
        print('{: }'.format(lab), ' -> ', '{: d}'.format(int(res[0])), ' [',end='')
        for s in sims: print('{:.3f}, '.format(s), end='');
        print(']')
        img2 = cv2.drawContours(img.copy(), [ctr], -1, (0,255,0), 1)
        plt.imshow(cv2.cvtColor(img2, cv2.COLOR_BGR2RGB)),plt.xticks([]),plt.yticks([])
        plt.show()
No. 2
-1  ->   1  [0.662, 0.825, 0.750, 0.728, 0.772, ]
No. 36
-1  ->   0  [0.823, 0.853, 0.660, 0.641, 0.697, ]
No. 50
-1  ->   5  [0.678, 0.659, 0.641, 0.769, 0.792, ]
No. 88
 0  ->  -1  [0.845, 0.712, 0.670, 0.654, 0.699, ]
No. 111
-1  ->   1  [0.577, 0.877, 0.797, 0.779, 0.815, ]
No. 113
-1  ->   0  [0.907, 0.868, 0.664, 0.685, 0.733, ]
No. 128
-1  ->   1  [0.563, 0.786, 0.790, 0.756, 0.765, ]
No. 136
-1  ->   1  [0.629, 0.826, 0.818, 0.755, 0.801, ]
No. 146
-1  ->   0  [0.821, 0.906, 0.668, 0.638, 0.671, ]
No. 155
-1  ->   0  [0.906, 0.774, 0.646, 0.698, 0.700, ]
No. 195
 0  ->  -1  [0.803, 0.755, 0.731, 0.611, 0.716, ]
No. 212
 1  ->  -1  [0.776, 0.693, 0.722, 0.682, 0.669, ]
No. 215
 1  ->   2  [0.572, 0.964, 0.847, 0.802, 0.640, ]
No. 225
-1  ->   1  [0.563, 0.901, 0.847, 0.799, 0.719, ]
No. 258
 5  ->  -1  [0.659, 0.723, 0.684, 0.790, 0.668, ]
No. 282
 5  ->  -1  [0.514, 0.643, 0.647, 0.787, 0.619, ]
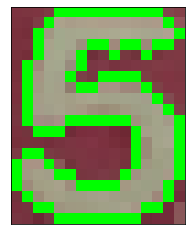
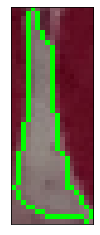
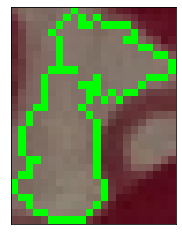
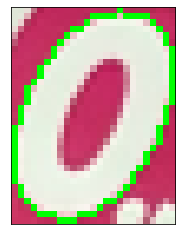
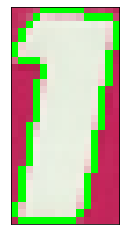
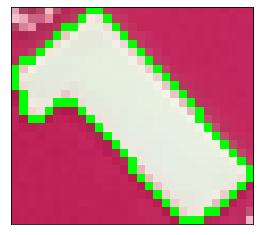
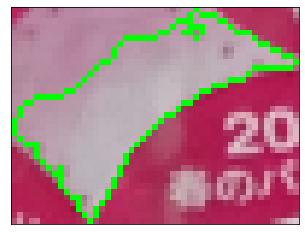
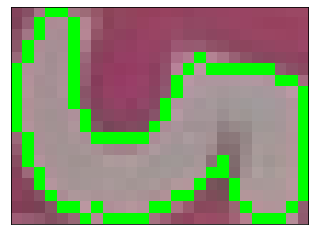
- 212番の輪郭は、初期一致度が0.7に達しなかったので、ICPが実施されず、"1"への一致度が高まらなかったのが問題か。
- 215番の輪郭は、なぜこれでうまくいかないのか…
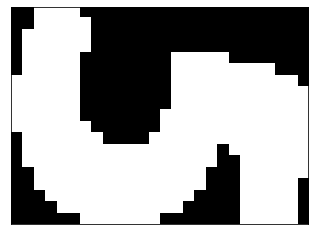
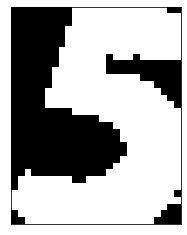
- 最後の2つの"5"は、よく見ると輪郭が結構歪んでる。シール領域を広げるような閾値変更を入れたので、点数文字領域が必要以上に浸食されたのか。
閾値の調整が必要?それとも画像全体の明るさ調整が必要?
ただ、そうしてしまうと、元の問題(輪郭どうしがくっ付いてしまう)がまた発生するか…
OpenCVでのRGB→HSV変換の式を見ると、色相(Hue)、彩度(Saturation)は明るさには依存しなさそう。
https://docs.opencv.org/4.5.1/de/d25/imgproc_color_conversions.html
やっぱり彩度の閾値検討か…
彩度閾値検討
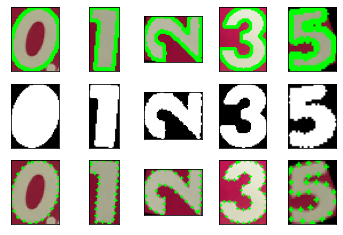
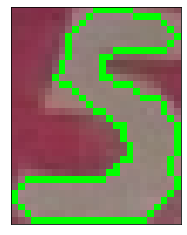
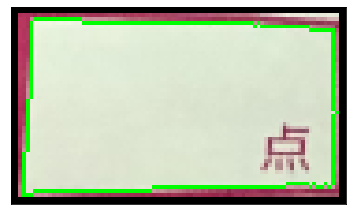
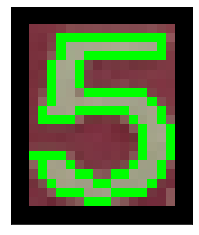
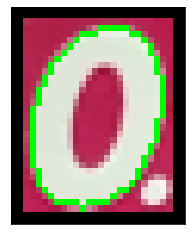
最後の2つの"5"の画像を改めて見てみます。
plt.subplot(121), plt.imshow(cv2.cvtColor(subimgs[258], cv2.COLOR_BGR2RGB)),plt.xticks([]),plt.yticks([])
plt.subplot(122), plt.imshow(cv2.cvtColor(subimgs[282], cv2.COLOR_BGR2RGB)),plt.xticks([]),plt.yticks([])
plt.show()
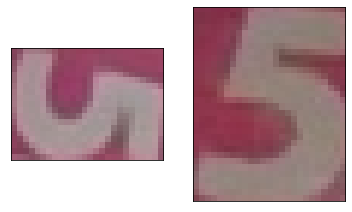
"5"の文字の内側にうっすら色がついているような。
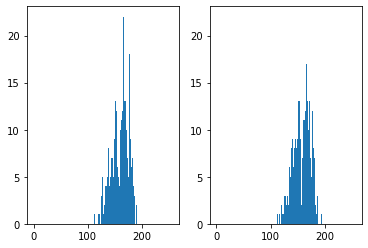
彩度のヒストグラムを出してみる。
img258_hsv = cv2.cvtColor(subimgs[258], cv2.COLOR_BGR2HSV)
img282_hsv = cv2.cvtColor(subimgs[282], cv2.COLOR_BGR2HSV)
plt.subplot(121), plt.hist(img258_hsv[:,:,1].ravel(), 256, [0,256])
plt.subplot(122), plt.hist(img282_hsv[:,:,1].ravel(), 256, [0,256])
plt.show()
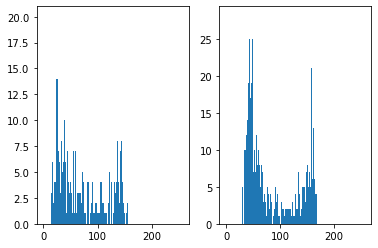
あまりはっきりした閾値が出ない…
間違えてRGB値で見てみましたが、どうもB、Gのほうがしっかり分かれていそう。
plt.subplot(121), plt.hist(subimgs[258][:,:,0].ravel(), 256, [0,256])
plt.subplot(122), plt.hist(subimgs[258][:,:,0].ravel(), 256, [0,256])
plt.show()
plt.subplot(121), plt.hist(subimgs[258][:,:,1].ravel(), 256, [0,256])
plt.subplot(122), plt.hist(subimgs[258][:,:,1].ravel(), 256, [0,256])
plt.show()
plt.subplot(121), plt.hist(subimgs[258][:,:,2].ravel(), 256, [0,256])
plt.subplot(122), plt.hist(subimgs[258][:,:,2].ravel(), 256, [0,256])
plt.show()
今回はシールの色がピンク色で、色相も青寄りな部分もあったので、Gの値で識別するのがよさそうに思います。
トラックバーで動かしながら見てみる。
def thresholding_img258(thresh):
    ret, img2 = cv2.threshold(subimgs[258][:,:,1], thresh, 255, cv2.THRESH_BINARY)
    plt.imshow(img2, cmap='gray'), plt.xticks([]), plt.yticks([])
    plt.show()

interact(thresholding_img258, thresh=(0,255));
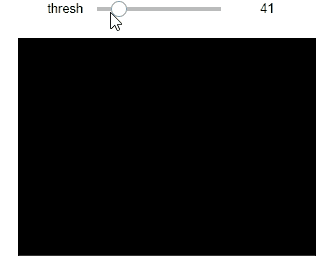
- 閾値が58より下がると真っ黒になる(全値が閾値を超えると反転するのか?)
- 85ぐらいから"5"の文字の形が見え出す
- 128ぐらいがベストか
- 閾値を上げていくと文字形状が細くなっていき、最終的に真っ黒になる
大津の2値化検討
閾値をなんとなくで決めるのもあんまりかな、と思うので、大津の2値化を試してみる。
こちらは、二峰性の分布になっている前提で、最適な閾値を計算するアルゴリズムのよう。
https://docs.opencv.org/4.x/d7/d4d/tutorial_py_thresholding.html
ret258, img258_thresh = cv2.threshold(subimgs[258][:,:,1], 0, 255, cv2.THRESH_BINARY+cv2.THRESH_OTSU)
print('Otsu threshold: ', ret258)
plt.imshow(img258_thresh, cmap='gray'), plt.xticks([]), plt.yticks([])
plt.show()
Otsu threshold: 109.0
いい感じかな。
もう一つの画像でも。
ret282, img282_thresh = cv2.threshold(subimgs[282][:,:,1], 0, 255, cv2.THRESH_BINARY+cv2.THRESH_OTSU)
print('Otsu threshold: ', ret282)
plt.imshow(img282_thresh, cmap='gray'), plt.xticks([]), plt.yticks([])
plt.show()
Otsu threshold: 93.0
こちらもいい感じ。
処理の変更
処理は以下の流れを検討。
- まず今まで通り色相、彩度で点数文字領域を検出
- 点数文字領域の小画像(外接矩形による)を用意
- 小画像のG値で、大津の2値化を適用
- 小画像を使っているので、この中に含まれるのはほぼシール領域のピンク色と白色だけになるかと。そうなればG値での2値化でOK。
- この小画像で改めて輪郭を検出
上の2値化画像で輪郭検出できるか?
ctrs, hier = cv2.findContours(img258_thresh, cv2.RETR_EXTERNAL, cv2.CHAIN_APPROX_NONE)
print(len(ctrs))
print(ctrs[0].shape)
img = cv2.cvtColor(img258_thresh, cv2.COLOR_GRAY2RGB)
img = cv2.drawContours(img, ctrs, -1, (0,255,0), 1)
plt.imshow(img), plt.xticks([]), plt.yticks([])
plt.show()
1
(92, 1, 2)

ctrs, hier = cv2.findContours(img282_thresh, cv2.RETR_EXTERNAL, cv2.CHAIN_APPROX_NONE)
print(len(ctrs))
print(ctrs[0].shape)
img = cv2.cvtColor(img282_thresh, cv2.COLOR_GRAY2RGB)
img = cv2.drawContours(img, ctrs, -1, (0,255,0), 1)
plt.imshow(img), plt.xticks([]), plt.yticks([])
plt.show()
1
(130, 1, 2)

一応輪郭は取得できました。2つ目の画像は下側はちょっと変な感じですが…
余計な輪郭領域も出てくる可能性がありそうなので、輪郭の周長を使って、必要なものか判定するようにします。
これで全画像で改めてやってみる。
スクリプトでは、refine_contours()関数ということで、大津の2値化により輪郭データを再生成する処理を作り、detect_candidate_contours()関数で輪郭検出を行った後にこれを実施します。
一旦ここではrefine_contours()関数を定義してこれを使って、輪郭検出~SVM学習、推論までを再度実施します。
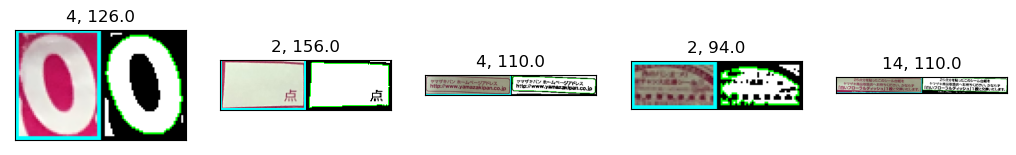
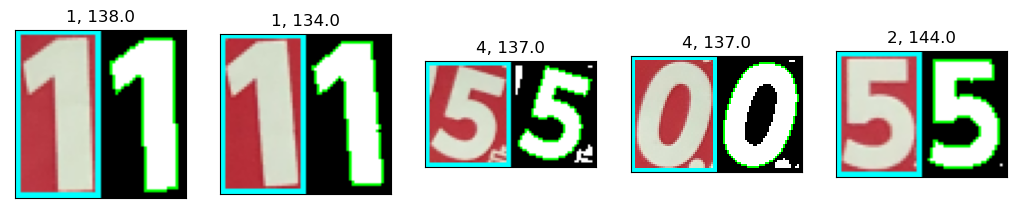
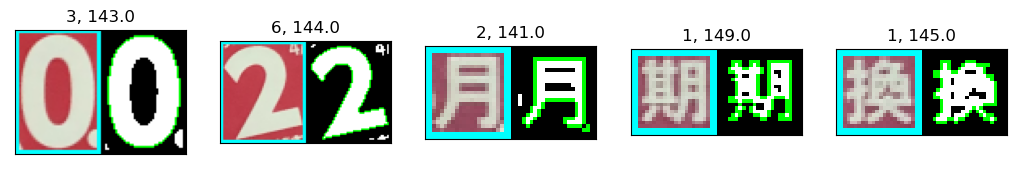
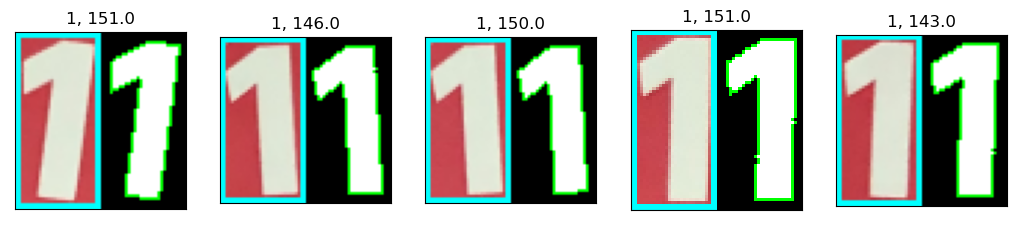
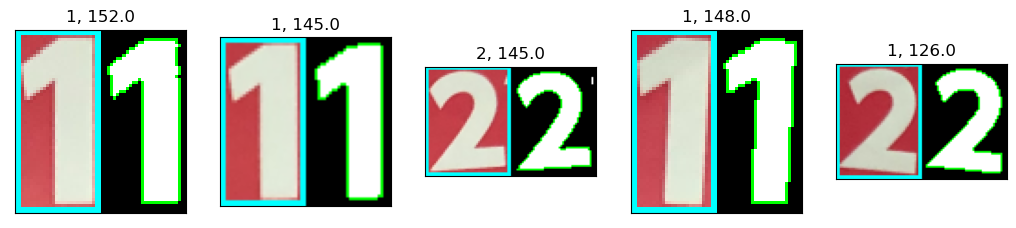
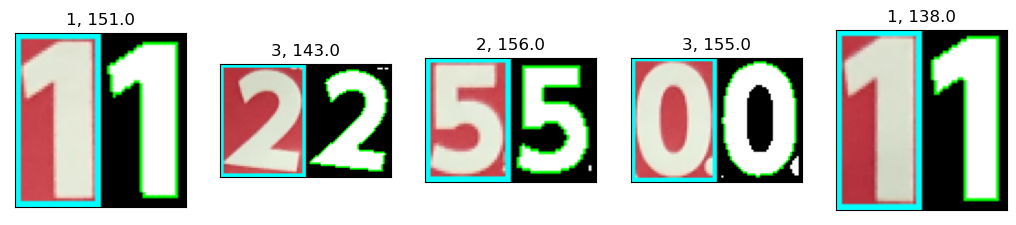
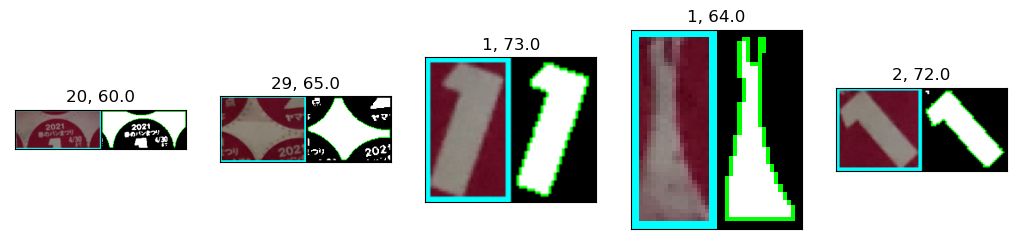
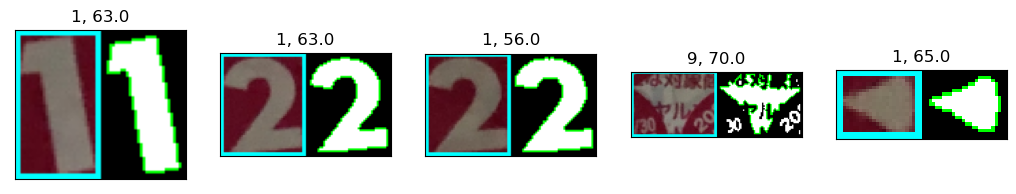
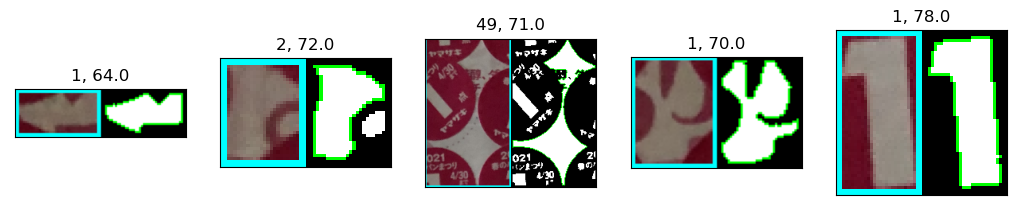
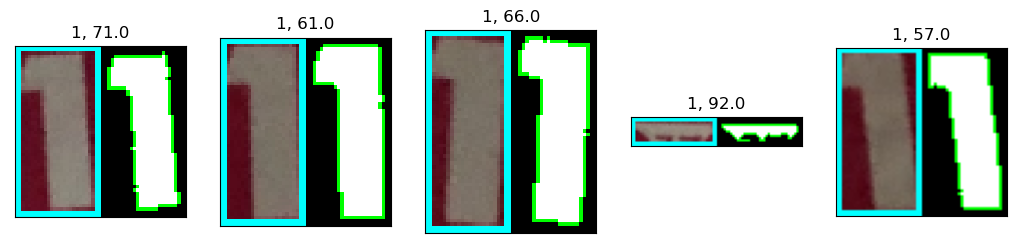
この処理の中で、2値化画像そのままで輪郭検出を行うと、前景領域が画像の端に接触しているせいか、外接矩形の辺を含んだ輪郭が検出されてしまうことがありました。そのため、輪郭検出の前に、cv2.copyMakeBorder()で外周に背景領域を追加しました。
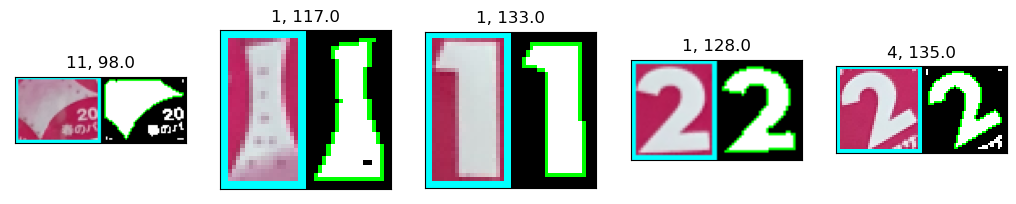
# image: Entire image containing multiple contours
# contours: Contours contained in "image" (Retrieved by cv2.findContours(), the origin is same as "image")
def refine_contours(image, contours):
    subctrs = []
    subimgs = []
    binimgs = []
    thresholds = []
    n_ctrs = []
    for ctr in contours:
        img, _ = create_contour_area_image(image, ctr)
        # Thresholding using G value in BGR format
        thresh, binimg = cv2.threshold(img[:,:,1], 0, 255, cv2.THRESH_BINARY + cv2.THRESH_OTSU)
        # Add black region around thresholded image, to detect contours correctly
        binimg = cv2.copyMakeBorder(binimg, 2,2,2,2, cv2.BORDER_CONSTANT, 0)
        ctrs2, _ = cv2.findContours(binimg, cv2.RETR_EXTERNAL, cv2.CHAIN_APPROX_NONE)
        max_len = 0
        for ctr2 in ctrs2:
            if max_len <= ctr2.shape[0]:
                max_ctr = ctr2
                max_len = ctr2.shape[0]
        subctrs += [max_ctr]
        subimgs += [img]
        binimgs += [binimg]
        thresholds += [thresh]
        n_ctrs += [len(ctrs2)]
    debug_info = (binimgs, thresholds, n_ctrs)
    return subctrs, subimgs, debug_info
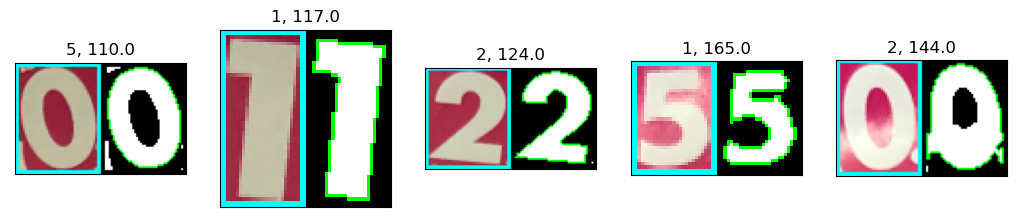
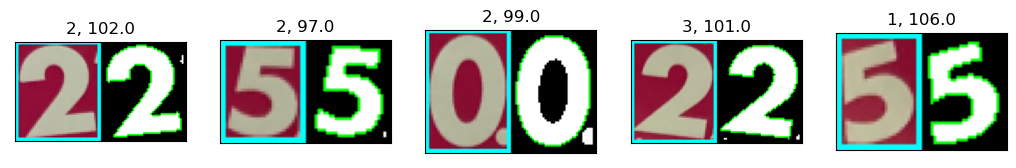
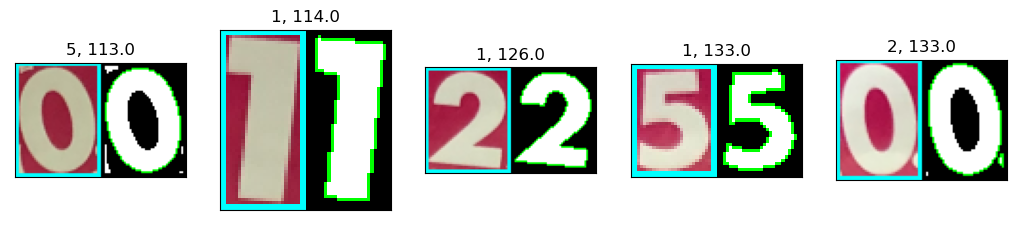
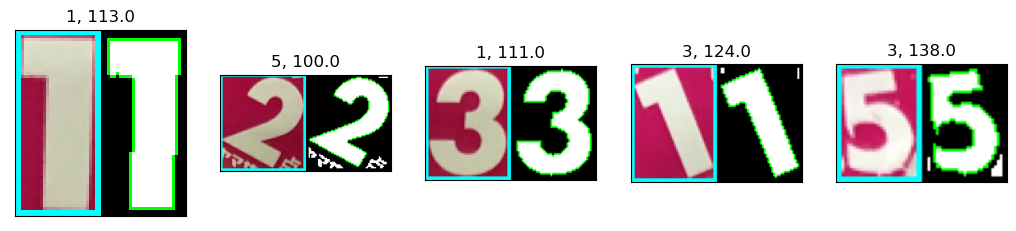
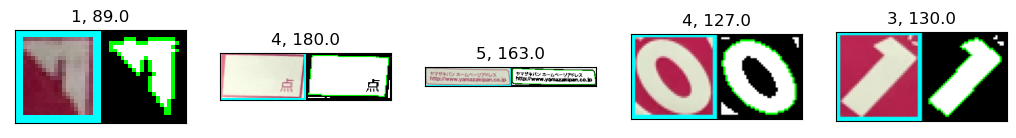
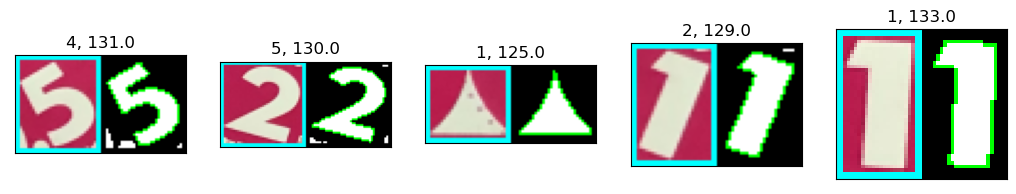
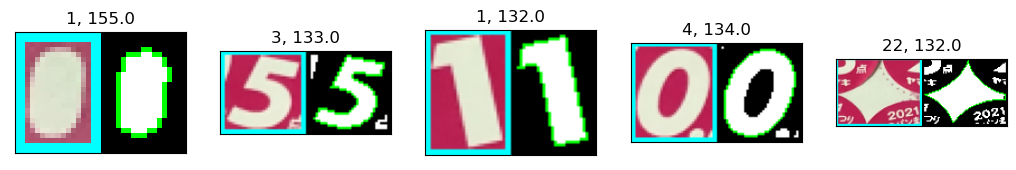
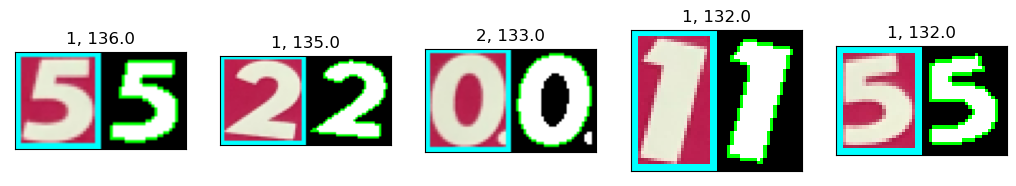
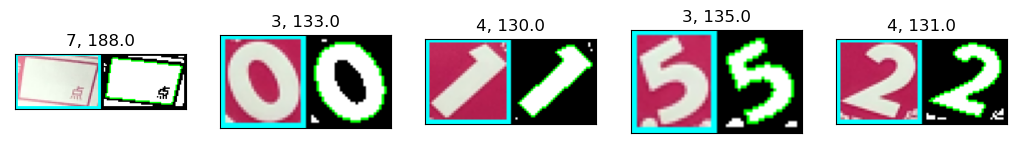
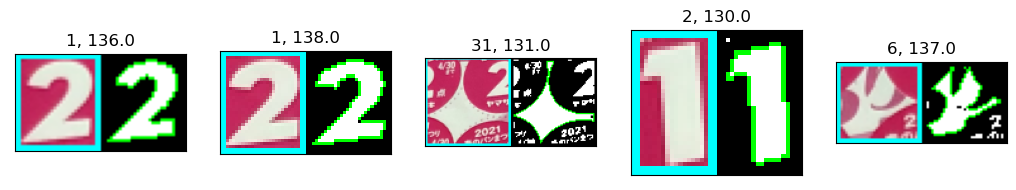
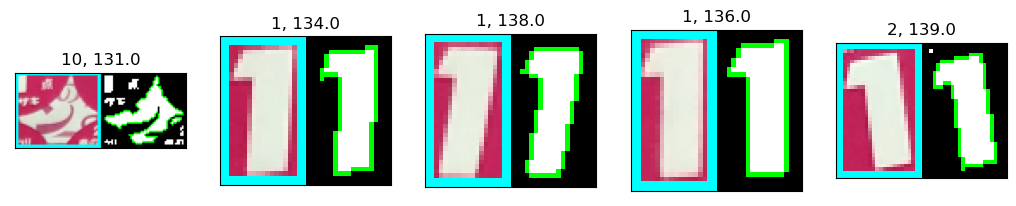
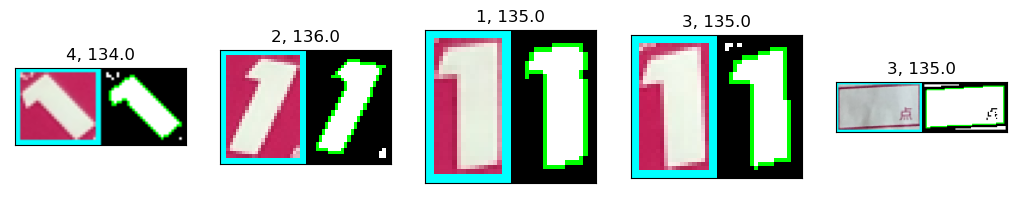
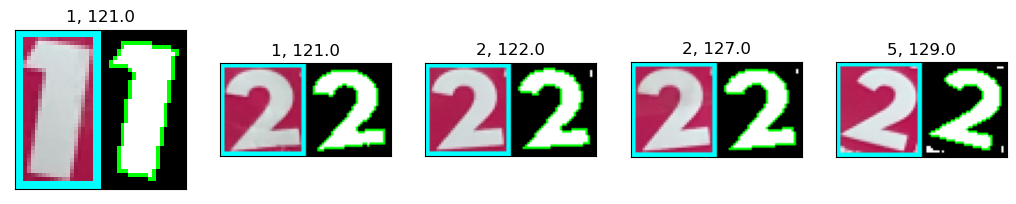
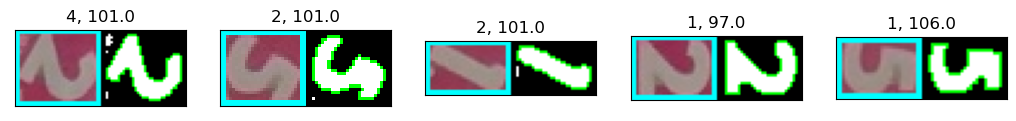
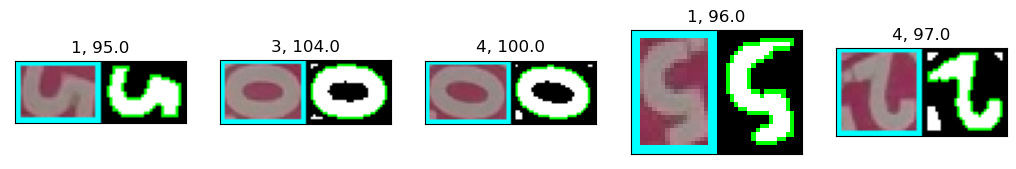
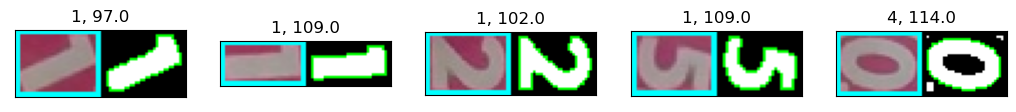
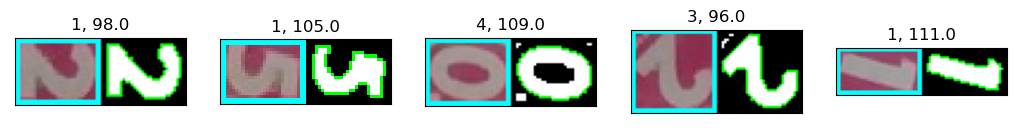
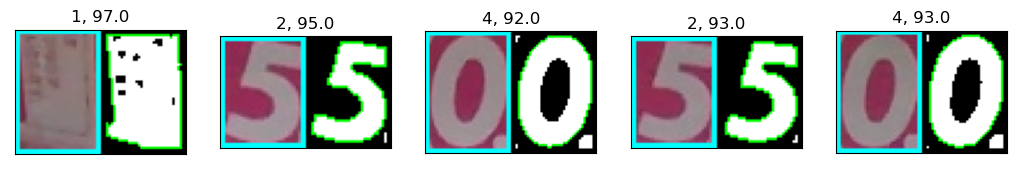
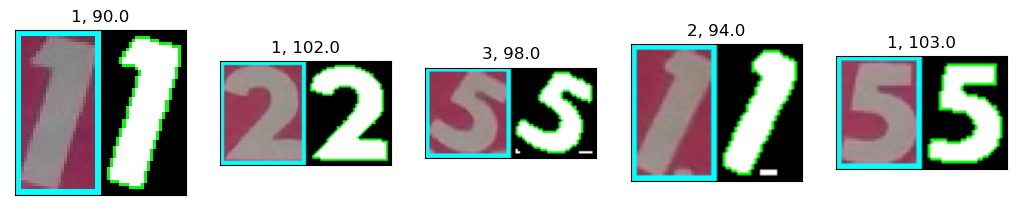
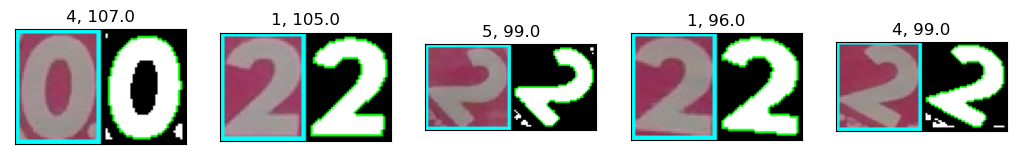
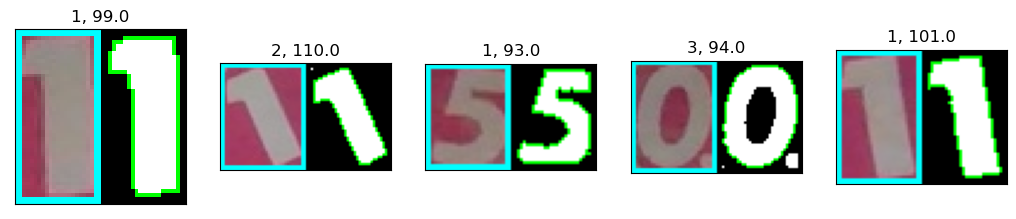
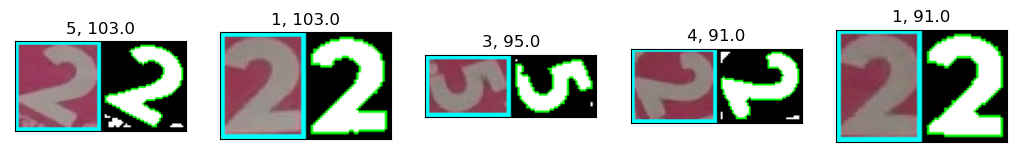
subctrs_all = []

i = 1
plt.figure(figsize=(12.8, 9.6), dpi=100)
for ctrs, img in zip(ctrs_all, resized_imgs):
    subctrs, subimgs, dbginfo = refine_contours(img, ctrs)
    subctrs_all += subctrs
    for subctr, subimg, binimg, th, nc in zip(subctrs, subimgs, dbginfo[0], dbginfo[1], dbginfo[2]):
        im = cv2.cvtColor(binimg, cv2.COLOR_GRAY2RGB)
        im = cv2.drawContours(im, [subctr], -1, (0,255,0), 1)
        im2 = cv2.copyMakeBorder(subimg, 2,2,2,2, cv2.BORDER_CONSTANT, value=(255,255,0))
        im = np.hstack((im2, im))
        plt.subplot(1,5,i), plt.imshow(cv2.cvtColor(im, cv2.COLOR_BGR2RGB)), plt.xticks([]), plt.yticks([]), plt.title(str(nc) + ', ' + str(th))
        if i == 5:
            i = 1
            plt.show()
            plt.figure(figsize=(12.8, 9.6), dpi=100)
        else:
            i+=1
if i != 1:
    plt.show();


<Figure size 1280x960 with 0 Axes>
画像の明るさに従って2値化の閾値が変わっている様子も見られます。
ctr_datasets_all = [contour_dataset(ctr) for ctr in subctrs_all]
テンプレート再作成
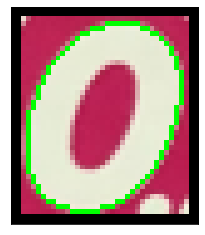
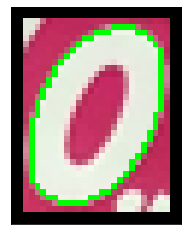
一応テンプレートも作り直します。
# ctr: Should be output of create_contour_area_image() (Origin of points is the origin of bounding box)
def create_upright_solid_contour(ctr):
    ctr2 = ctr.copy()
    (cx,cy),(w,h),angle = cv2.minAreaRect(ctr2)
    print((cx,cy),(w,h),angle)
    M = cv2.getRotationMatrix2D((cx,cy), angle, 1)
    for i in range(ctr2.shape[0]):
        ctr2[i,0,:] = ( M @ np.array([ctr2[i,0,0], ctr2[i,0,1], 1]) ).astype('int')
    rect = cv2.boundingRect(ctr2)
    img = np.zeros((rect[3],rect[2]), 'uint8')
    ctr2 -= rect[0:2]
    M[:,2] -= rect[0:2]
    img = cv2.drawContours(img, [ctr2], -1, 255,-1)
    return img, M, ctr2
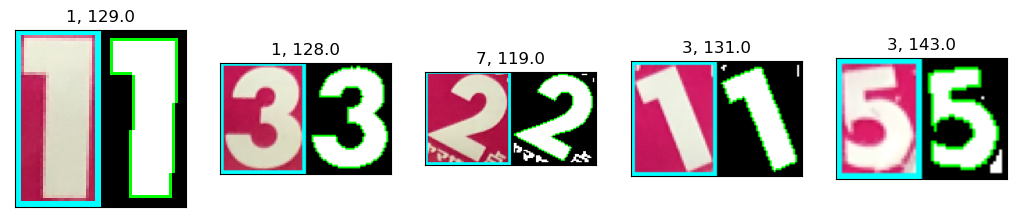
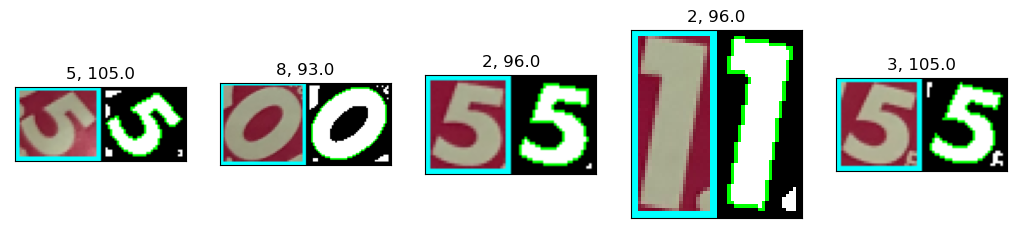
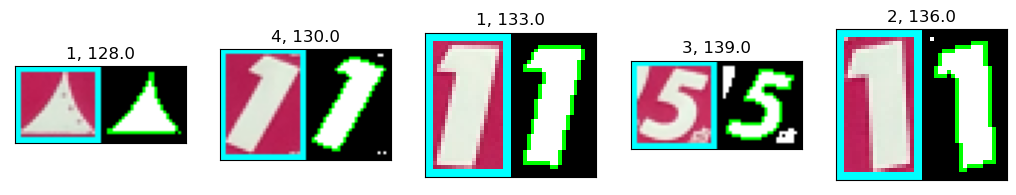
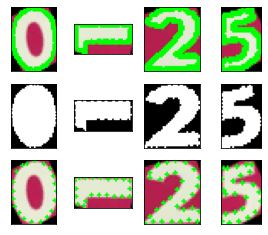
subimgs1 = []
subctrs1 = []
binimgs1 = []
subctrs1_selected_pts = []
for i,(num, idx) in enumerate(template_idx1.items()):
    binimg, M, ctr2 = create_upright_solid_contour(subctrs_all[idx])
    img2 = cv2.copyMakeBorder(subimgs_all[idx].copy(), 2,2,2,2, cv2.BORDER_CONSTANT, 0)
    img2 = cv2.warpAffine(img2, M, (binimg.shape[1], binimg.shape[0]))
    subimgs1 += [img2]
    subctrs1 += [ctr2]
    binimgs1 += [binimg]
    ctr_selected_pts = [j for j in range(ctr2.shape[0]) if j % 5 == 0]
    if i != 0:
        subctrs1_selected_pts += [ctr_selected_pts]
    ctr_img = cv2.drawContours(img2.copy(), [ctr2], -1, (0,255,0), 2)
    pts_img = img2.copy()
    for p in ctr_selected_pts:
        pts_img = cv2.drawMarker(pts_img, ctr2[p,0,:], (0,255,0), markerType=cv2.MARKER_CROSS, markerSize=3)
    plt.subplot(3,5,1+i), plt.imshow(cv2.cvtColor(ctr_img, cv2.COLOR_BGR2RGB)), plt.xticks([]), plt.yticks([])
    plt.subplot(3,5,6+i), plt.imshow(binimg,cmap='gray'), plt.xticks([]), plt.yticks([])
    plt.subplot(3,5,11+i), plt.imshow(cv2.cvtColor(pts_img, cv2.COLOR_BGR2RGB), cmap='gray'), plt.xticks([]), plt.yticks([])
plt.show()
(21.5, 27.5) (49.0, 37.0) 90.0
(13.5, 26.0) (48.0, 21.0) 90.0
(22.68317222595215, 26.331684112548828) (49.15483856201172, 38.308929443359375) 84.2894058227539
(23.0, 29.0) (54.0, 40.0) 90.0
(16.576923370361328, 18.115385055541992) (23.533935546875, 30.201885223388672) 11.309932708740234
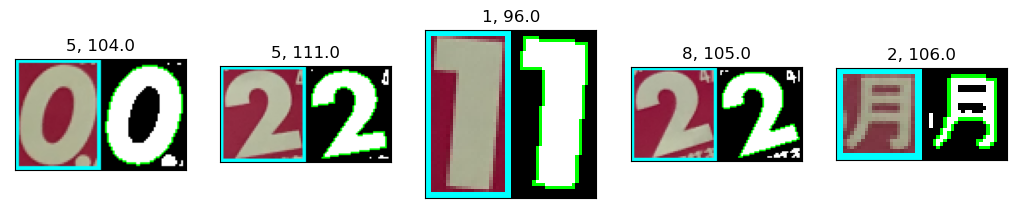
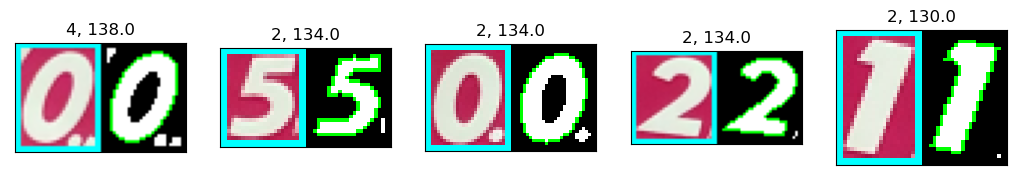
subimgs3 = []
subctrs3 = []
binimgs3 = []
subctrs3_selected_pts = []
for i,(num, idx) in enumerate(template_idx3.items()):
    global_idx = idx +len(ctrs_all[0]) +len(ctrs_all[1])
    binimg, M, ctr2 = create_upright_solid_contour(subctrs_all[global_idx])
    img2 = cv2.copyMakeBorder(subimgs_all[global_idx].copy(), 2,2,2,2, cv2.BORDER_CONSTANT, 0)
    img2 = cv2.warpAffine(img2, M, (binimg.shape[1], binimg.shape[0]))
    subimgs3 += [img2]
    subctrs3 += [ctr2]
    binimgs3 += [binimg]
    ctr_selected_pts = [j for j in range(ctr2.shape[0]) if j % 5 == 0]
    if i != 0:
        subctrs3_selected_pts += [ctr_selected_pts]
    ctr_img = cv2.drawContours(img2.copy(), [ctr2], -1, (0,255,0), 2)
    pts_img = img2.copy()
    for p in ctr_selected_pts:
        pts_img = cv2.drawMarker(pts_img, ctr2[p,0,:], (0,255,0), markerType=cv2.MARKER_CROSS, markerSize=3)
    plt.subplot(3,5,1+i), plt.imshow(cv2.cvtColor(ctr_img, cv2.COLOR_BGR2RGB)), plt.xticks([]), plt.yticks([])
    plt.subplot(3,5,6+i), plt.imshow(binimg,cmap='gray'), plt.xticks([]), plt.yticks([])
    plt.subplot(3,5,11+i), plt.imshow(cv2.cvtColor(pts_img, cv2.COLOR_BGR2RGB), cmap='gray'), plt.xticks([]), plt.yticks([])
plt.show()

subimgs3.insert(3, subimgs1[3])
subctrs3.insert(3, subctrs1[3])
binimgs3.insert(3, binimgs1[3])
subctrs3_selected_pts.insert(2, subctrs1_selected_pts[2])
(20.0, 30.0) (54.0, 34.0) 90.0
(14.694175720214844, 29.631237030029297) (53.20975875854492, 22.366018295288086) 88.02507019042969
(23.0, 29.5) (53.0, 40.0) 90.0
(15.0, 23.0) (40.0, 26.0) 90.0
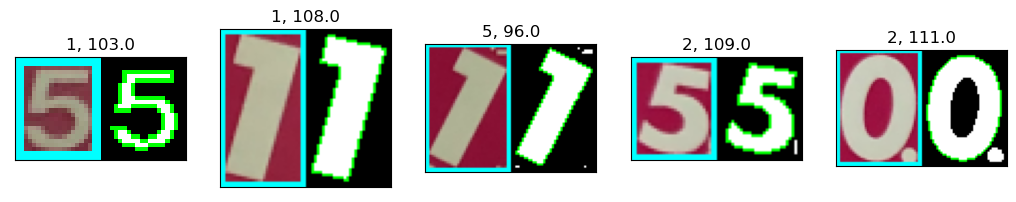
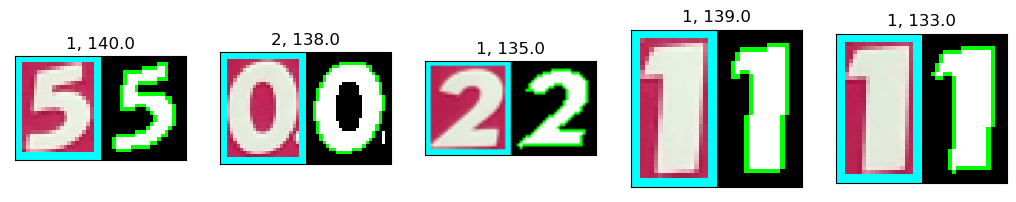
subimgs5 = []
subctrs5 = []
binimgs5 = []
subctrs5_selected_pts = []
for i,(num, idx) in enumerate(template_idx5.items()):
    global_idx = idx +len(ctrs_all[0]) +len(ctrs_all[1]) +len(ctrs_all[2]) +len(ctrs_all[3])
    binimg, M, ctr2 = create_upright_solid_contour(subctrs_all[global_idx])
    img2 = cv2.copyMakeBorder(subimgs_all[global_idx].copy(), 2,2,2,2, cv2.BORDER_CONSTANT, 0)
    img2 = cv2.warpAffine(img2, M, (binimg.shape[1], binimg.shape[0]))
    subimgs5 += [img2]
    subctrs5 += [ctr2]
    binimgs5 += [binimg]
    ctr_selected_pts = [j for j in range(ctr2.shape[0]) if j % 5 == 0]
    if i != 0:
        subctrs5_selected_pts += [ctr_selected_pts]
    ctr_img = cv2.drawContours(img2.copy(), [ctr2], -1, (0,255,0), 2)
    pts_img = img2.copy()
    for p in ctr_selected_pts:
        pts_img = cv2.drawMarker(pts_img, ctr2[p,0,:], (0,255,0), markerType=cv2.MARKER_CROSS, markerSize=3)
    plt.subplot(3,5,1+i), plt.imshow(cv2.cvtColor(ctr_img, cv2.COLOR_BGR2RGB)), plt.xticks([]), plt.yticks([])
    plt.subplot(3,5,6+i), plt.imshow(binimg,cmap='gray'), plt.xticks([]), plt.yticks([])
    plt.subplot(3,5,11+i), plt.imshow(cv2.cvtColor(pts_img, cv2.COLOR_BGR2RGB), cmap='gray'), plt.xticks([]), plt.yticks([])
plt.show()

subimgs5.insert(3, subimgs1[3])
subctrs5.insert(3, subctrs1[3])
binimgs5.insert(3, binimgs1[3])
subctrs5_selected_pts.insert(2, subctrs1_selected_pts[2])
(18.000001907348633, 21.999996185302734) (28.621667861938477, 40.24921798706055) 26.56505012512207
(13.478048324584961, 21.897563934326172) (37.43586730957031, 18.717931747436523) 77.90524291992188
(23.389907836914062, 20.866973876953125) (32.087181091308594, 36.876312255859375) 16.699243545532227
(19.799999237060547, 17.899995803833008) (21.01903533935547, 33.98823165893555) 26.56505012512207
いずれもきちんと文字の輪郭が取れました。
ついでに、cv2.minAreaRect()の結果も見てみましたが、回転角が90°となっているものがいくつかあり。この関数では条件によって回転角が0°, 90°, 180°, 270°に丸められて、矩形サイズも元画像のものがそのまま使われる、ということかと思われます。
テンプレートデータ作成
# Prepare template data for "0"
templates1 = [template_dataset(subctrs1[0], 0)]
templates3 = [template_dataset(subctrs3[0], 0)]
templates5 = [template_dataset(subctrs5[0], 0)]
# Prepare template data for other numbers
numbers = [1, 2, 3, 5]
for i,num in enumerate(numbers):
    templates1 += [template_dataset(subctrs1[i+1], num, subctrs1_selected_pts[i])]
    templates3 += [template_dataset(subctrs3[i+1], num, subctrs3_selected_pts[i])]
    templates5 += [template_dataset(subctrs5[i+1], num, subctrs5_selected_pts[i])]
一致度計算
similarities_all = []
converted_imgs_all = []
print('  Contour No. ', end='')
for i,target_ctr in enumerate(ctr_datasets_all):
    templates = select_template(i)
    print(i, ' ', end='')
    sims, imgs = get_similarities(target_ctr, templates)
    similarities_all += [sims]
    converted_imgs_all += [imgs]
  Contour No. 0  1  2  3  4  5  6  7  8  9  10  11  12  13  14  15  16  17  18  19  20  21  22  23  24  25  26  27  28  29  30  31  32  33  34  35  36  37  38  39  40  41  42  43  44  45  46  47  48  49  50  51  52  53  54  55  56  57  58  59  60  61  62  63  64  65  66  67  68  69  70  71  72  73  74  75  76  77  78  79  80  81  82  83  84  85  86  87  88  89  90  91  92  93  94  95  96  97  98  99  100  101  102  103  104  105  106  107  108  109  110  111  112  113  114  115  116  117  118  119  120  121  122  123  124  125  126  127  128  129  130  131  132  133  134  135  136  137  138  139  140  141  142  143  144  145  146  147  148  149  150  151  152  153  154  155  icp: Insufficient destination points
156  157  158  159  160  161  162  163  164  165  166  167  168  169  170  171  172  173  174  175  176  177  178  179  180  181  182  183  184  185  186  187  188  189  190  191  192  193  194  195  196  197  198  199  200  201  202  203  204  205  206  207  208  209  210  211  212  213  214  215  216  217  218  219  220  221  222  223  224  225  226  227  228  229  230  231  232  233  234  235  236  237  238  239  240  241  242  243  244  245  246  247  248  249  250  251  252  253  254  255  256  257  258  259  260  261  262  263  264  265  266  267  268  269  270  271  272  273  274  275  276  277  278  279  280  281  282  283  284  285  286  287  288  289
SVM学習、推論
svm_inputs = copy.deepcopy(similarities_all)
svm_labels = copy.deepcopy(labels_all)

train_data, train_labels = get_random_sample(svm_inputs, svm_labels, [-1,0,1,2,3,5], 20, seed=1)
svm = prepare_svm(train_data, train_labels)
result = svm.predict(np.array(svm_inputs, 'float32'))
print_stat(result, svm_labels)
label -1 : {-1: 44, 0: 17, 1:  2, 2:  0, 3:  0, 5:  2, }
label  0 : {-1:  3, 0: 33, 1:  0, 2:  0, 3:  0, 5:  0, }
label  1 : {-1:  0, 0:  0, 1: 88, 2:  0, 3:  0, 5:  0, }
label  2 : {-1:  0, 0:  0, 1:  0, 2: 57, 3:  0, 5:  0, }
label  3 : {-1:  0, 0:  0, 1:  0, 2:  0, 3:  2, 5:  0, }
label  5 : {-1:  0, 0:  0, 1:  0, 2:  0, 3:  0, 5: 42, }
まだ誤認識はありますが、点数計算に支障が出る感じではないので、このまま進めます。
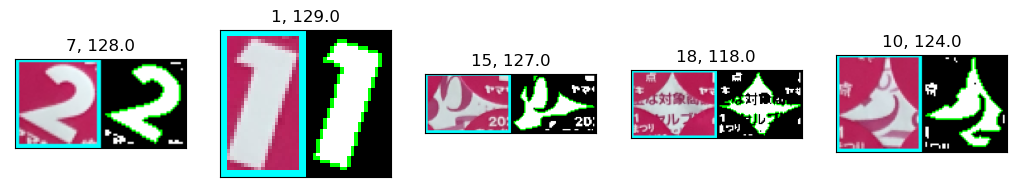
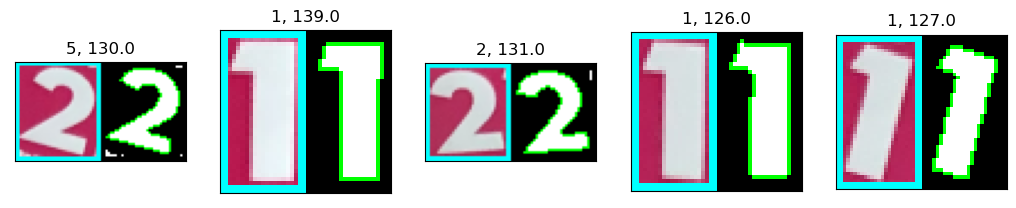
subimgs = copy.deepcopy(subimgs_all)
subctrs = copy.deepcopy(subctrs_all)

for i,(sims,lab,res,img,ctr) in enumerate(zip(svm_inputs, svm_labels, result[1], subimgs, subctrs)):
    if lab != res[0]:
        print('No.', i)
        print('{: }'.format(lab), ' -> ', '{: d}'.format(int(res[0])), ' [',end='')
        for s in sims: print('{:.3f}, '.format(s), end='');
        print(']')
        img2 = cv2.copyMakeBorder(img.copy(), 2,2,2,2, cv2.BORDER_CONSTANT, 0)
        img2 = cv2.drawContours(img2, [ctr], -1, (0,255,0), 1)
        plt.imshow(cv2.cvtColor(img2, cv2.COLOR_BGR2RGB)),plt.xticks([]),plt.yticks([])
        plt.show()
No. 0
-1  ->   0  [0.828, 0.849, 0.684, 0.649, 0.689, ]

No. 4
-1  ->   0  [0.828, 0.785, 0.686, 0.658, 0.688, ]
No. 5
-1  ->   0  [0.829, 0.793, 0.671, 0.622, 0.665, ]
No. 36
-1  ->   0  [0.831, 0.844, 0.685, 0.659, 0.704, ]
No. 39
-1  ->   0  [0.807, 0.778, 0.689, 0.645, 0.686, ]

No. 50
-1  ->   5  [0.473, 0.681, 0.601, 0.702, 0.801, ]
No. 71
-1  ->   0  [0.850, 0.682, 0.619, 0.638, 0.707, ]

No. 74
-1  ->   0  [0.844, 0.680, 0.624, 0.637, 0.732, ]

No. 75
-1  ->   0  [0.837, 0.671, 0.618, 0.631, 0.734, ]

No. 76
-1  ->   0  [0.851, 0.681, 0.616, 0.630, 0.687, ]

No. 77
-1  ->   0  [0.836, 0.667, 0.619, 0.634, 0.733, ]
No. 78
-1  ->   0  [0.849, 0.673, 0.617, 0.631, 0.734, ]
No. 111
-1  ->   5  [0.376, 0.841, 0.858, 0.839, 0.839, ]
No. 136
-1  ->   0  [0.750, 0.795, 0.688, 0.714, 0.587, ]
No. 143
-1  ->   1  [0.632, 0.921, 0.754, 0.746, 0.775, ]

No. 146
-1  ->   0  [0.809, 0.879, 0.658, 0.653, 0.678, ]

No. 158
 0  ->  -1  [0.766, 0.841, 0.688, 0.571, 0.682, ]

No. 185
-1  ->   0  [0.775, 0.886, 0.701, 0.621, 0.640, ]
No. 195
 0  ->  -1  [0.694, 0.700, 0.573, 0.579, 0.684, ]

No. 197
 0  ->  -1  [0.716, 0.777, 0.694, 0.604, 0.665, ]
No. 219
-1  ->   0  [0.791, 0.680, 0.681, 0.667, 0.673, ]
No. 225
-1  ->   0  [0.720, 0.772, 0.620, 0.691, 0.584, ]
No. 226
-1  ->   1  [0.594, 0.816, 0.750, 0.733, 0.699, ]
No. 265
-1  ->   0  [0.790, 0.857, 0.647, 0.655, 0.671, ]

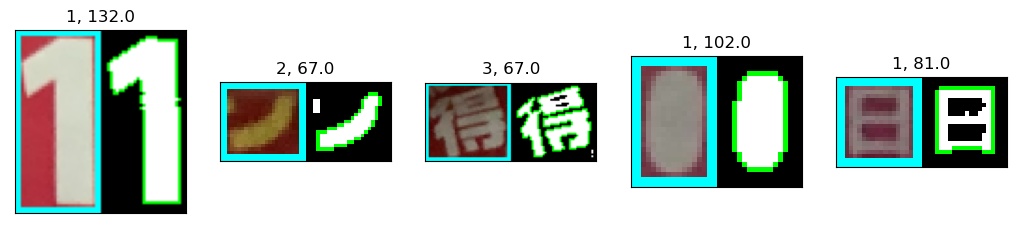
50番目輪郭は、点数文字でない文字(交換期限の"5月"の文字)で、今年(2022年)のシール台紙でも同じような文字があったので、学習データに追加し、再度学習を実施しておきます。
train_data += [svm_inputs[50]]
train_labels += [svm_labels[50]]

svm = prepare_svm(train_data, train_labels)
result = svm.predict(np.array(svm_inputs, 'float32'))
print_stat(result, svm_labels)
label -1 : {-1: 44, 0: 17, 1:  2, 2:  0, 3:  0, 5:  2, }
label  0 : {-1:  3, 0: 33, 1:  0, 2:  0, 3:  0, 5:  0, }
label  1 : {-1:  0, 0:  0, 1: 88, 2:  0, 3:  0, 5:  0, }
label  2 : {-1:  0, 0:  0, 1:  0, 2: 57, 3:  0, 5:  0, }
label  3 : {-1:  0, 0:  0, 1:  0, 2:  0, 3:  2, 5:  0, }
label  5 : {-1:  0, 0:  0, 1:  0, 2:  0, 3:  0, 5: 42, }
subimgs = copy.deepcopy(subimgs_all)
subctrs = copy.deepcopy(subctrs_all)

for i,(sims,lab,res,img,ctr) in enumerate(zip(svm_inputs, svm_labels, result[1], subimgs, subctrs)):
    if lab != res[0]:
        print('No.', i)
        print('{: }'.format(lab), ' -> ', '{: d}'.format(int(res[0])), ' [',end='')
        for s in sims: print('{:.3f}, '.format(s), end='');
        print(']')
        img2 = cv2.copyMakeBorder(img.copy(), 2,2,2,2, cv2.BORDER_CONSTANT, 0)
        img2 = cv2.drawContours(img2, [ctr], -1, (0,255,0), 1)
        plt.imshow(cv2.cvtColor(img2, cv2.COLOR_BGR2RGB)),plt.xticks([]),plt.yticks([])
        plt.show()
No. 0
-1  ->   0  [0.828, 0.849, 0.684, 0.649, 0.689, ]
No. 4
-1  ->   0  [0.828, 0.785, 0.686, 0.658, 0.688, ]

No. 5
-1  ->   0  [0.829, 0.793, 0.671, 0.622, 0.665, ]

No. 36
-1  ->   0  [0.831, 0.844, 0.685, 0.659, 0.704, ]

No. 39
-1  ->   0  [0.807, 0.778, 0.689, 0.645, 0.686, ]
No. 50
-1  ->   5  [0.473, 0.681, 0.601, 0.702, 0.801, ]

No. 71
-1  ->   0  [0.850, 0.682, 0.619, 0.638, 0.707, ]
No. 74
-1  ->   0  [0.844, 0.680, 0.624, 0.637, 0.732, ]
No. 75
-1  ->   0  [0.837, 0.671, 0.618, 0.631, 0.734, ]
No. 76
-1  ->   0  [0.851, 0.681, 0.616, 0.630, 0.687, ]
No. 77
-1  ->   0  [0.836, 0.667, 0.619, 0.634, 0.733, ]

No. 78
-1  ->   0  [0.849, 0.673, 0.617, 0.631, 0.734, ]

No. 111
-1  ->   5  [0.376, 0.841, 0.858, 0.839, 0.839, ]

No. 136
-1  ->   0  [0.750, 0.795, 0.688, 0.714, 0.587, ]

No. 143
-1  ->   1  [0.632, 0.921, 0.754, 0.746, 0.775, ]
No. 146
-1  ->   0  [0.809, 0.879, 0.658, 0.653, 0.678, ]
No. 158
 0  ->  -1  [0.766, 0.841, 0.688, 0.571, 0.682, ]
No. 185
-1  ->   0  [0.775, 0.886, 0.701, 0.621, 0.640, ]

No. 195
 0  ->  -1  [0.694, 0.700, 0.573, 0.579, 0.684, ]
No. 197
 0  ->  -1  [0.716, 0.777, 0.694, 0.604, 0.665, ]

No. 219
-1  ->   0  [0.791, 0.680, 0.681, 0.667, 0.673, ]

No. 225
-1  ->   0  [0.720, 0.772, 0.620, 0.691, 0.584, ]

No. 226
-1  ->   1  [0.594, 0.816, 0.750, 0.733, 0.699, ]

No. 265
-1  ->   0  [0.790, 0.857, 0.647, 0.655, 0.671, ]
特に学習データ追加をしても変わりませんでした。もしかしたらすでに含まれていたかも。
調整はこんなところで諦めにします。
ということで、テンプレートデータとSVMデータを保存。
svm.save('harupan_data/harupan_svm_220412.dat')
# ctr_list: List of contours for (0, 1, 2, 3, 5)
# pts_idx_list: List of selected point indices for (1, 2, 3, 5)
def save_templates(filename, ctr_list, pts_idx_list):
    with open(filename, mode='w') as f:
        save_data = []
        save_data += [{'num': 0, 'ctr': ctr_list[0].tolist(), 'pts': [0]}]
        for num, ctr, pts_idx in zip([1,2,3,5], ctr_list[1:5], pts_idx_list):
            save_data += [{'num': num, 'ctr': ctr.tolist(), 'pts': pts_idx}]
        json.dump(save_data, f, indent=2)
    return

save_templates('harupan_data/templates2019_220412.json', subctrs1, subctrs1_selected_pts)
save_templates('harupan_data/templates2020_220412.json', subctrs3, subctrs3_selected_pts)
save_templates('harupan_data/templates2021_220412.json', subctrs5, subctrs5_selected_pts)
変更したスクリプト(harupan.py)も以下に全体を示します。
######################################################
# Importing libraries
######################################################
import cv2
import numpy as np
from matplotlib import pyplot as plt
import math
import copy
import random
import json

######################################################
# Detecting contours
######################################################
def reduce_resolution(img, res_th=800):
    h, w, chs = img.shape
    if h > res_th or w > res_th:
        k = float(res_th)/h if w > h else float(res_th)/w
    else:
        k = 1.0
    rtn_img = cv2.resize(img, None, fx=k, fy=k, interpolation=cv2.INTER_AREA)
    return rtn_img

def harupan_binarize(img, sat_th=100):
    hsv = cv2.cvtColor(img, cv2.COLOR_BGR2HSV)
    # Convert hue value (rotation, mask by saturation)
    hsv[:,:,0] = np.where(hsv[:,:,0] < 50, hsv[:,:,0]+180, hsv[:,:,0])
    hsv[:,:,0] = np.where(hsv[:,:,1] < sat_th, 0, hsv[:,:,0])
    # Thresholding with cv2.inRange()
    binary_img = cv2.inRange(hsv[:,:,0], 135, 190)
    return binary_img

def detect_candidate_contours(image, res_th=800, sat_th=100):
    img = reduce_resolution(image, res_th)
    binimg = harupan_binarize(img, sat_th)
    # Retrieve all points on the contours (cv2.CHAIN_APPROX_NONE)
    contours, hierarchy = cv2.findContours(binimg, cv2.RETR_TREE, cv2.CHAIN_APPROX_NONE)
    indices0 = [i for i,hier in enumerate(hierarchy[0,:,:]) if hier[3] == -1]
    indices1 = [i for i,hier in enumerate(hierarchy[0,:,:]) if hier[3] in indices0]
    contours1 = [contours[i] for i in indices1]
    contours1_filtered = [ctr for ctr in contours1 if cv2.contourArea(ctr) > float(res_th)*float(res_th)/4000]
    return contours1_filtered, img

# image: Entire image containing multiple contours
# contours: Contours contained in "image" (Retrieved by cv2.findContours(), the origin is same as "image")
def refine_contours(image, contours):
    subctrs = []
    subimgs = []
    binimgs = []
    thresholds = []
    n_ctrs = []
    for ctr in contours:
        img, _ = create_contour_area_image(image, ctr)
        # Thresholding using G value in BGR format
        thresh, binimg = cv2.threshold(img[:,:,1], 0, 255, cv2.THRESH_BINARY + cv2.THRESH_OTSU)
        # Add black region around thresholded image, to detect contours correctly
        binimg = cv2.copyMakeBorder(binimg, 2,2,2,2, cv2.BORDER_CONSTANT, 0)
        ctrs2, _ = cv2.findContours(binimg, cv2.RETR_EXTERNAL, cv2.CHAIN_APPROX_NONE)
        max_len = 0
        for ctr2 in ctrs2:
            if max_len <= ctr2.shape[0]:
                max_ctr = ctr2
                max_len = ctr2.shape[0]
        subctrs += [max_ctr]
        subimgs += [img]
        binimgs += [binimg]
        thresholds += [thresh]
        n_ctrs += [len(ctrs2)]
    debug_info = (binimgs, thresholds, n_ctrs)
    return subctrs, subimgs, debug_info

######################################################
# Auxiliary functions
######################################################
def create_contour_area_image(img, ctr):
    x,y,w,h = cv2.boundingRect(ctr)
    rtn_img = img[y:y+h,x:x+w,:].copy()
    rtn_ctr = ctr.copy()
    origin = np.array([x,y])
    for c in rtn_ctr:
        c[0,:] -= origin
    return rtn_img, rtn_ctr

# ctr: Should be output of create_contour_area_image() (Origin of points is the origin of bounding box)
# img_shape: Optional, tuple of (image_height, image_width), if omitted, calculated from ctr
def create_solid_contour(ctr, img_shape=(int(0),int(0))):
    if img_shape == (int(0),int(0)):
        _,_,w,h = cv2.boundingRect(ctr)
    else:
        h,w = img_shape
    img = np.zeros((h,w), 'uint8')
    img = cv2.drawContours(img, [ctr], -1, 255, -1)
    return img

# ctr: Should be output of create_contour_area_image() (Origin of points is the origin of bounding box)
def create_upright_solid_contour(ctr):
    ctr2 = ctr.copy()
    (cx,cy),(w,h),angle = cv2.minAreaRect(ctr2)
    M = cv2.getRotationMatrix2D((cx,cy), angle, 1)
    for i in range(ctr2.shape[0]):
        ctr2[i,0,:] = ( M @ np.array([ctr2[i,0,0], ctr2[i,0,1], 1]) ).astype('int')
    rect = cv2.boundingRect(ctr2)
    img = np.zeros((rect[3],rect[2]), 'uint8')
    ctr2 -= rect[0:2]
    M[:,2] -= rect[0:2]
    img = cv2.drawContours(img, [ctr2], -1, 255,-1)
    return img, M, ctr2


######################################################
# Dataset classes
######################################################
class contour_dataset:
    def __init__(self, ctr):
        self.ctr = ctr.copy()
        self.rrect = cv2.minAreaRect(ctr)
        self.box = cv2.boxPoints(self.rrect)
        self.solid = create_solid_contour(ctr)
        self.pts = np.array([p for p in ctr[:,0,:]])

class template_dataset:
    def __init__(self, ctr, num, selected_idx=[0]):
        self.ctr = ctr.copy()
        self.num = num
        self.rrect = cv2.minAreaRect(ctr)
        self.box = cv2.boxPoints(self.rrect)
        if num == 0:
            self.solid,_,_ = create_upright_solid_contour(ctr)
        else:
            self.solid = create_solid_contour(ctr)
        self.pts = np.array([ctr[idx,0,:] for idx in selected_idx])


######################################################
# ICP
######################################################
# pts: list of 2D points, or ndarray of shape (n,2)
# query: 2D point to find nearest neighbor
def find_nearest_neighbor(pts, query):
    min_distance_sq = float('inf')
    min_idx = 0
    for i, p in enumerate(pts):
        d = np.dot(query - p, query - p)
        if(d < min_distance_sq):
            min_distance_sq = d
            min_idx = i
    return min_idx, np.sqrt(min_distance_sq)

# src, dst: ndarray, shape is (n,2) (n: number of points)
def estimate_affine_2d(src, dst):
    n = min(src.shape[0], dst.shape[0])
    x = dst[0:n].flatten()
    A = np.zeros((2*n,6))
    for i in range(n):
        A[i*2,0] = src[i,0]
        A[i*2,1] = src[i,1]
        A[i*2,2] = 1
        A[i*2+1,3] = src[i,0]
        A[i*2+1,4] = src[i,1]
        A[i*2+1,5] = 1
    M = np.linalg.inv(A.T @ A) @ A.T @ x
    return M.reshape([2,3])

# Find optimum affine matrix using ICP algorithm
# src_pts: ndarray, shape is (n_s,2) (n_s: number of points)
# dst_pts: ndarray, shape is (n_d,2) (n_d: number of points, n_d should be larger or equal to n_s)
# initial_matrix: ndarray, shape is (2,3)
def icp(src_pts, dst_pts, max_iter=20, initial_matrix=np.array([[1.0, 0.0, 0.0], [0.0, 1.0, 0.0]])):
    default_affine_matrix = np.array([[1.0, 0.0, 0.0], [0.0, 1.0, 0.0]])
    if dst_pts.shape[0] < src_pts.shape[0]:
        print("icp: Insufficient destination points")
        return default_affine_matrix, False
    if initial_matrix.shape != (2,3):
        print("icp: Illegal shape of initial_matrix")
        return default_affine_matrix, False
    M = initial_matrix
    # Store indices of the nearest neighbor point of dst_pts to the converted point of src_pts
    nn_idx = []
    for i in range(max_iter):
        nn_idx_tmp = []
        dst_pts_list = [p for p in dst_pts]
        idx_list = list(range(0,dst_pts.shape[0]))
        for p in src_pts:
            p2 = M @ np.array([p[0], p[1], 1])
            idx, d = find_nearest_neighbor(dst_pts_list, p2)
            nn_idx_tmp += [idx_list[idx]]
            del dst_pts_list[idx]
            del idx_list[idx]
        if nn_idx != [] and nn_idx == nn_idx_tmp:
            break
        dst_pts2 = np.zeros_like(src_pts)
        for j,idx in enumerate(nn_idx_tmp):
            dst_pts2[j,:] = dst_pts[idx,:]
        M = estimate_affine_2d(src_pts, dst_pts2)
        nn_idx = nn_idx_tmp
        if i == max_iter -1:
            return M, False
    return M, True


######################################################
# Calculating similarity and determining the number
######################################################
def binary_image_similarity(img1, img2):
    if img1.shape != img2.shape:
        print('binary_image_similarity: Different image size')
        return 0.0
    xor_img = cv2.bitwise_xor(img1, img2)
    return 1.0 - np.float(np.count_nonzero(xor_img)) / (img1.shape[0]*img2.shape[1])

# src, dst: contour_dataset or template_dataset (holding member variables box, solid)
def get_transform_by_rotated_rectangle(src, dst):
    # Rotated patterns are created when starting index is slided
    dst_box2 = np.vstack([dst.box, dst.box])
    max_similarity = 0.0
    max_converted_img = np.zeros((dst.solid.shape[1], dst.solid.shape[0]), 'uint8')
    for i in range(4):
        M = cv2.getAffineTransform(src.box[0:3], dst_box2[i:i+3])
        converted_img = cv2.warpAffine(src.solid, M, dsize=(dst.solid.shape[1], dst.solid.shape[0]), flags=cv2.INTER_NEAREST)
        similarity = binary_image_similarity(converted_img, dst.solid)
        if similarity > max_similarity:
            M_rtn = M
            max_similarity = similarity
            max_converted_img = converted_img
    return M_rtn, max_similarity, max_converted_img

def get_similarity_with_template(target_data, template_data, sim_th_high=0.95, sim_th_low=0.7):
    _,(w1,h1), _ = target_data.rrect
    _,(w2,h2), _ = template_data.rrect
    r = w1/h1 if w1 < h1 else h1/w1
    r = r * h2/w2 if w2 < h2 else r * w2/h2
    M, sim_init, _ = get_transform_by_rotated_rectangle(template_data, target_data)
    if sim_init > sim_th_high or sim_init < sim_th_low or r > 1.4 or r < 0.7:
        dsize = (template_data.solid.shape[1], template_data.solid.shape[0])
        flags = cv2.INTER_NEAREST|cv2.WARP_INVERSE_MAP
        converted_img = cv2.warpAffine(target_data.solid, M, dsize=dsize, flags=flags)
        return sim_init, converted_img
    M, _ = icp(template_data.pts, target_data.pts, initial_matrix=M)
    Minv = cv2.invertAffineTransform(M)
    converted_ctr = np.zeros_like(target_data.ctr)
    for i in range(target_data.ctr.shape[0]):
        converted_ctr[i,0,:] = (Minv[:,0:2] @ target_data.ctr[i,0,:]) + Minv[:,2]
    converted_img = create_solid_contour(converted_ctr, img_shape=template_data.solid.shape)
    val = binary_image_similarity(converted_img, template_data.solid)
    return val, converted_img

def get_similarity_with_template_zero(target_data, template_data):
    dsize = (template_data.solid.shape[1], template_data.solid.shape[0])
    converted_img = cv2.resize(target_data.solid, dsize=dsize, interpolation=cv2.INTER_NEAREST)
    val = binary_image_similarity(converted_img, template_data.solid)
    return val, converted_img

def get_similarities(target, templates):
    similarities = []
    converted_imgs = []
    for tmpl in templates:
        if tmpl.num == 0:
            sim,converted_img = get_similarity_with_template_zero(target, tmpl)
        else:
            sim,converted_img = get_similarity_with_template(target, tmpl)
        similarities += [sim]
        converted_imgs += [converted_img]
    return similarities, converted_imgs

def calc_harupan(img, templates, svm):
    ctrs, resized_img = detect_candidate_contours(img, sat_th=50)
    print('Number of candidates: ', len(ctrs))
    subctrs, _, _ = refine_contours(resized_img, ctrs)
    subctr_datasets = [contour_dataset(ctr) for ctr in subctrs]
    ########
    #### Simple code
    # similarities = [get_similarities(d, templates)[0] for d in subctr_datasets]
    #### Code printing progress
    similarities = []
    for i,d in enumerate(subctr_datasets):
        print(i, end=' ')
        similarities += [get_similarities(d, templates)[0]]
    print('')
    ########
    _, result = svm.predict(np.array(similarities, 'float32'))
    result = result.astype('int')
    score = 0.0
    texts = {0:'0', 1:'1', 2:'2', 3:'3', 5:'.5'}
    font = cv2.FONT_HERSHEY_SIMPLEX
    for res, ctr in zip(result, ctrs):
        if res[0] == 5:
            score += 0.5
        elif res[0] != -1:
            score += res[0]

        # Annotating recognized numbers for confirmation
        if res[0] != -1:
            resized_img = cv2.drawContours(resized_img, [ctr], -1, (0,255,0), 3)
            x,y,_,_ = cv2.boundingRect(ctr)
            resized_img = cv2.putText(resized_img, texts[res[0]], (x,y), font, 1, (230,230,0), 5)
    return score, resized_img

######################################################
# Loading template data and SVM model
######################################################
def load_svm(filename):
    return cv2.ml.SVM_load(filename)

def load_templates(filename):
    with open(filename, mode='r') as f:
        load_data = json.load(f)
        templates_rtn = []
        for d in load_data:
            templates_rtn += [template_dataset(np.array(d['ctr']), d['num'], d['pts'])]
    return templates_rtn
再確認
変更したテンプレートデータ、SVMデータ、スクリプトできちんと動くかどうか、一応いくつかの画像で確認。
途中バグがあり、スクリプトを修正しながらやっていましたが、Jupyter notebookではカーネルの再起動をしないと基本的にはスクリプトの変更は反映されないとのこと。
調べてみると、importlibで対応している例がありました。
jupyter上でスムーズにモジュールを再読み込みする
import importlib
importlib.reload(harupan_data.harupan)
from harupan_data.harupan import *
svm = cv2.ml.SVM_load('harupan_data/harupan_svm_220412.dat')
templates2019 = load_templates('harupan_data/templates2019_220412.json')
templates2020 = load_templates('harupan_data/templates2020_220412.json')
templates2021 = load_templates('harupan_data/templates2021_220412.json')
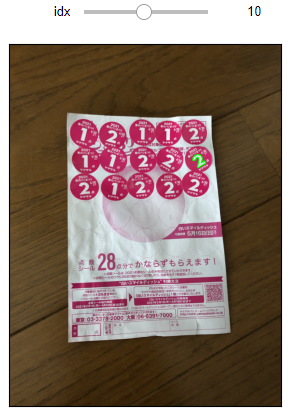
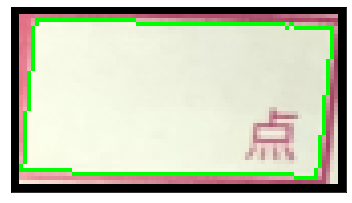
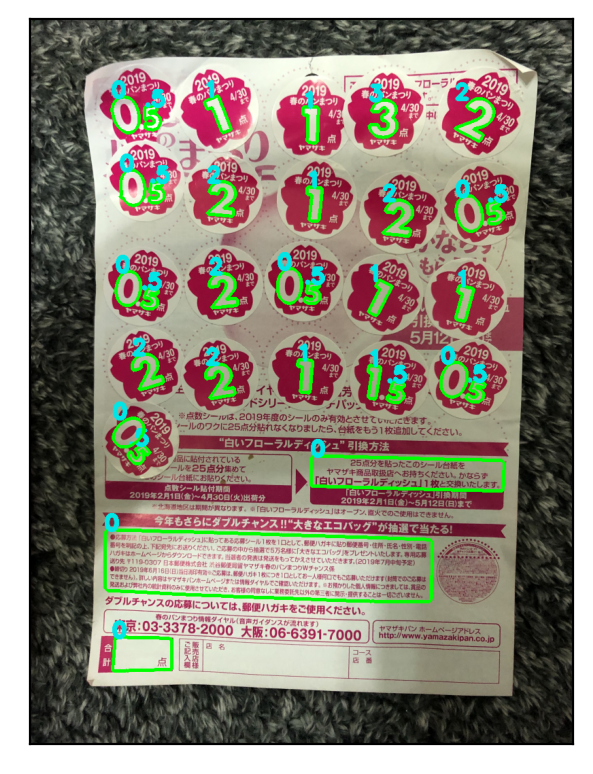
import time

t0 = time.time()
score, result_img = calc_harupan(img1, templates2019, svm)
t1 = time.time()
print('Score: ', score)
print('Elapsed time: ', t1 - t0)
plt.figure(figsize=(6.4,4.8), dpi=200)
plt.imshow(cv2.cvtColor(result_img, cv2.COLOR_BGR2RGB)), plt.xticks([]), plt.yticks([])
plt.show()
Number of candidates:  36
0 1 2 3 4 5 6 7 8 9 10 11 12 13 14 15 16 17 18 19 20 21 22 23 24 25 26 27 28 29 30 31 32 33 34 35
Score:  26.0
Elapsed time:  9.816221714019775
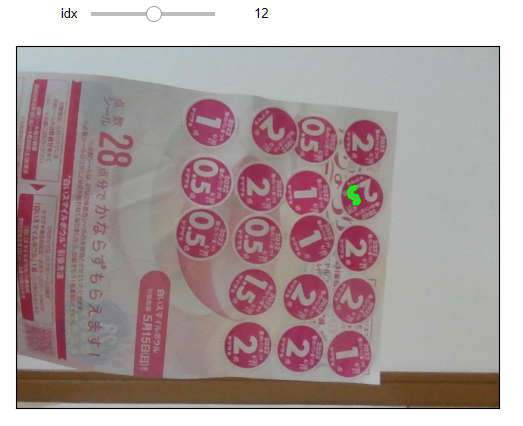
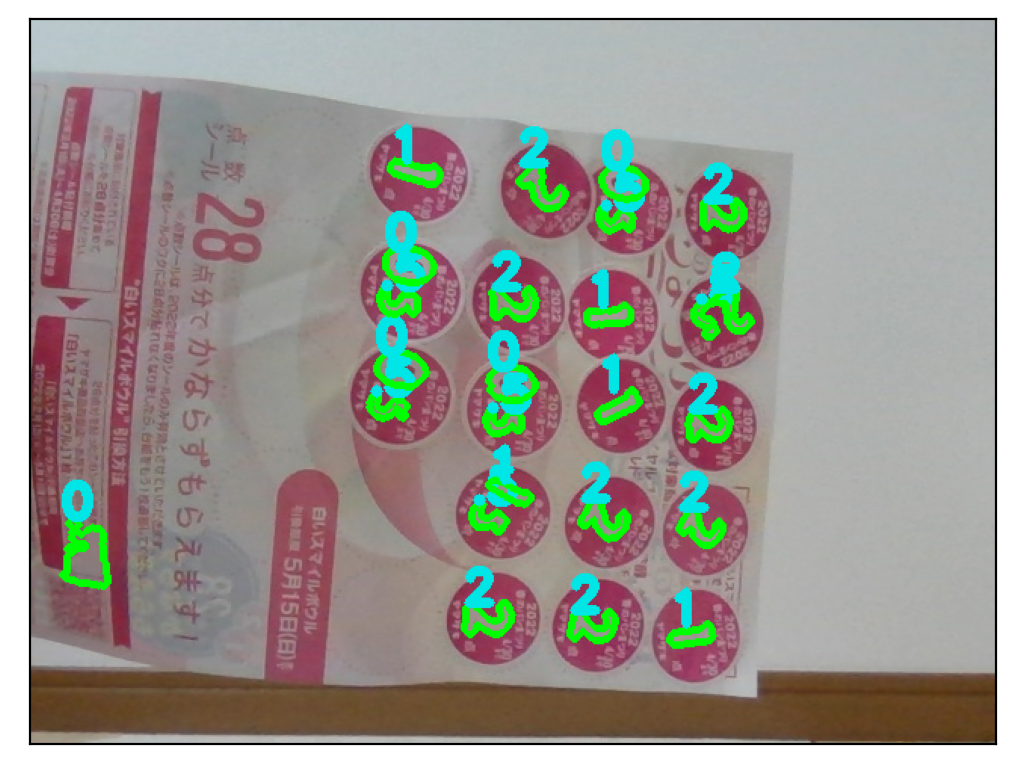
t0 = time.time()
score, result_img = calc_harupan(img8, templates2021, svm)
t1 = time.time()
print('Score: ', score)
print('Elapsed time: ', t1 - t0)
plt.figure(figsize=(6.4,4.8), dpi=200)
plt.imshow(cv2.cvtColor(result_img, cv2.COLOR_BGR2RGB)), plt.xticks([]), plt.yticks([])
plt.show()
Number of candidates:  25
0 1 2 3 4 5 6 7 8 9 10 11 12 13 14 15 16 17 18 19 20 21 22 23 24
Score:  26.0
Elapsed time:  3.784372091293335
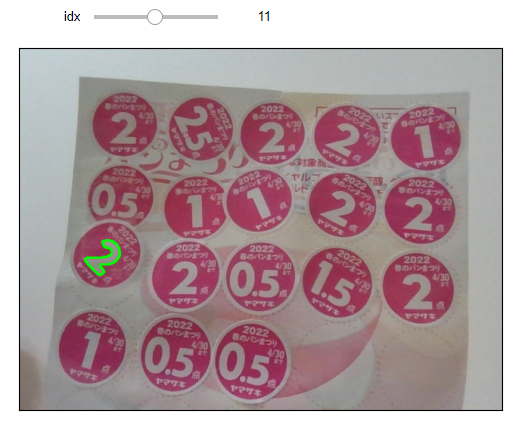
t0 = time.time()
score, result_img = calc_harupan(img9, templates2021, svm)
t1 = time.time()
print('Score: ', score)
print('Elapsed time: ', t1 - t0)
plt.figure(figsize=(6.4,4.8), dpi=200)
plt.imshow(cv2.cvtColor(result_img, cv2.COLOR_BGR2RGB)), plt.xticks([]), plt.yticks([])
plt.show()
Number of candidates:  24
0 1 2 3 4 5 6 7 8 9 10 11 12 13 14 15 16 17 18 19 20 21 22 23
Score:  26.0
Elapsed time:  6.287338733673096
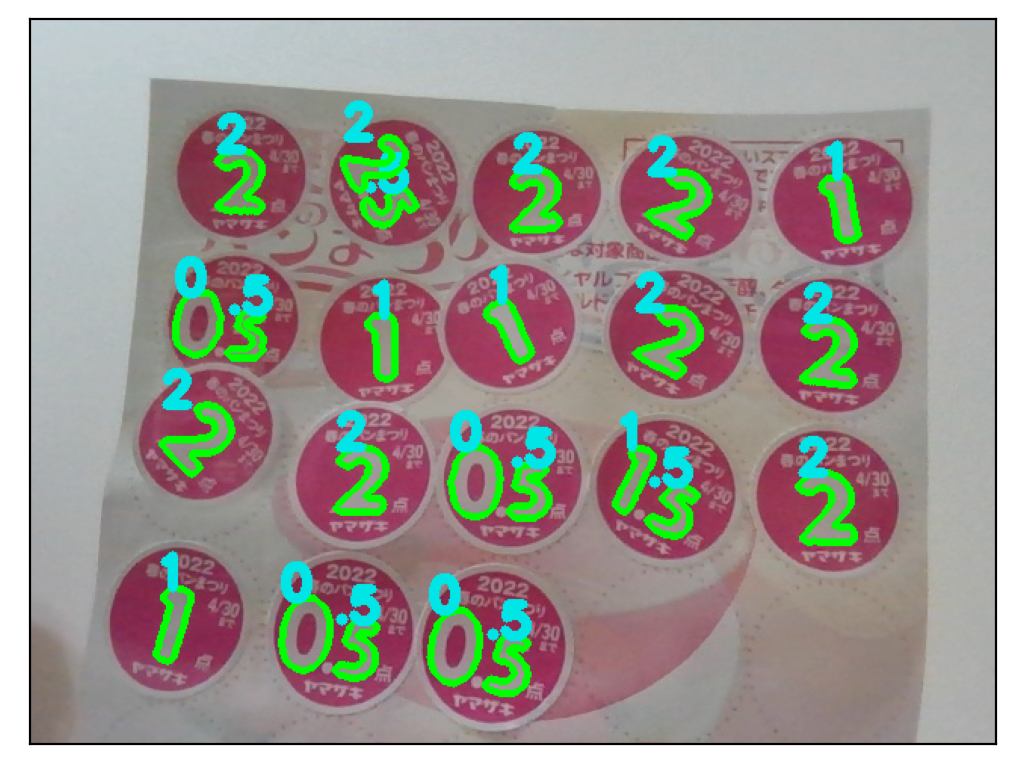
うまくいっていなかったPCカメラ画像でも、なんとか点数が正しく認識、計算できるようになりました。
今回はここまで
今回やったことをまとめると、
- 最初の2値化時の彩度閾値を変えることで、点数文字輪郭を正しく取得できるようになった
- 輪郭検出後、検出した輪郭周辺の小画像で再度2値化、輪郭検出を行うことで、輪郭形状を改善できるようになった
- 変更した処理でテンプレートデータ、SVMデータの再生成を行った
というところ。
次回、もう1点だけ変更したいところがあるので、それをやってみます。