春のパン祭りシール点数集計の続きです。
前回のおさらい
前回までで、ひとまず点数文字の輪郭が取れるようになりました。
- Hue,Saturation情報を使って2値化
- 階層認識ありで輪郭を検出、最上位階層の1つ下の輪郭を検出
ここから、テンプレートマッチングを使って文字の認識、識別をしていきたいと思います。
今回はテンプレート画像を用意するところまでとします。
検討内容
シール画像でのテンプレートマッチングをやりますが、いくつか考慮の必要なことが。
- どうやってテンプレート画像を用意するか
シールのデザインが年ごとに違ったので、その辺も要検討かな。 - 輪郭のままでテンプレートマッチングするか?
輪郭描画の関数を見たところ、輪郭の内部を塗りつぶすこともできるようで、テンプレートマッチングのマスクとして使えそうな感じがしています。 - シールの回転、変形にどう対処するか
シールの回転はもともと考えないとな、と思っていたところですが、回転を考慮した外接矩形を返してくれる関数があるようなので、これが使えそう。外接矩形の縦横比で変形へもある程度対応できそうな気がします。
以下検討してみます。
元データの用意
ひとまず今用意できている各年(2019,2020,2021)の画像から、今までにやった点数文字輪郭検出をして、そこからテンプレートにするものを選びたいと思います。
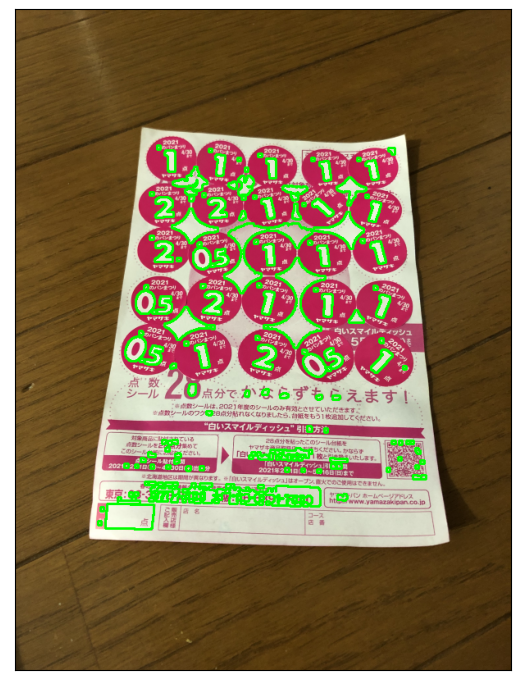
import cv2
import numpy as np
%matplotlib inline
from matplotlib import pyplot as plt

img1 = cv2.imread('harupan_190428_1.jpg')
img3 = cv2.imread('harupan_200317_1.jpg')
img5 = cv2.imread('harupan_210402_1.jpg')
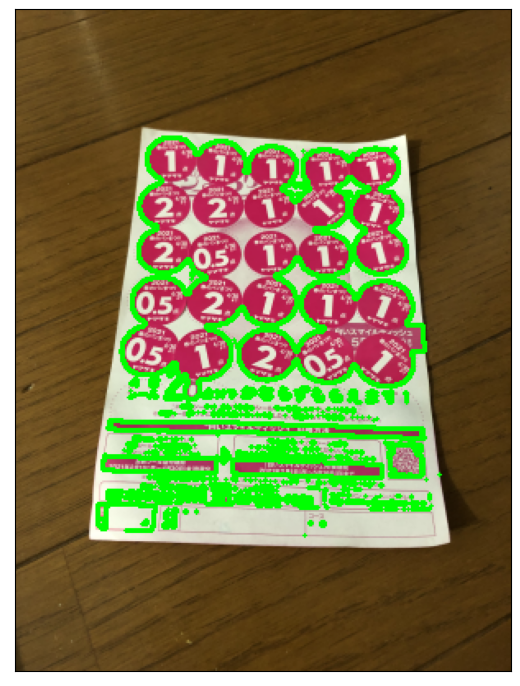
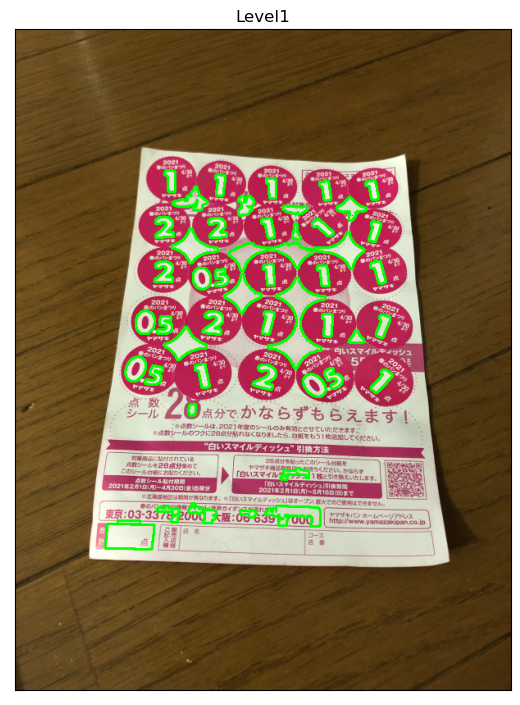
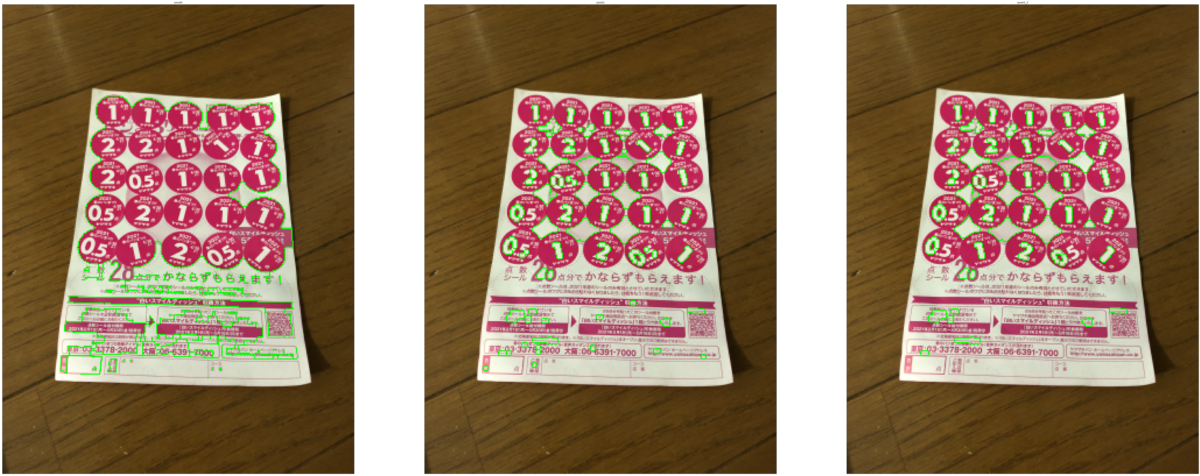
# image: Input image, BGR format
def calculate_harupan(image, debug):
    h, w, chs = image.shape
    if h > 800 or w > 800:
        k = 800.0/h if w > h else 800.0/w
    else:
        k = 1.0
    img = cv2.resize(image, None, fx=k, fy=k, interpolation=cv2.INTER_AREA)
    if debug:
        print('Resized to ', img.shape)
    hsv = cv2.cvtColor(img, cv2.COLOR_BGR2HSV)
    # Convert hue value (rotation, mask by saturation)
    hsv[:,:,0] = np.where(hsv[:,:,0] < 50, hsv[:,:,0]+180, hsv[:,:,0])
    hsv[:,:,0] = np.where(hsv[:,:,1] < 100, 0, hsv[:,:,0])
    # Thresholding with cv2.inRange(), using different threshold
    th_hue = cv2.inRange(hsv[:,:,0], 135, 190)
    contours, hierarchy = cv2.findContours(th_hue, cv2.RETR_TREE, cv2.CHAIN_APPROX_SIMPLE)
    indices0 = [i for i,hier in enumerate(hierarchy[0,:,:]) if hier[3] == -1]
    indices1 = [i for i,hier in enumerate(hierarchy[0,:,:]) if hier[3] in indices0]
    if debug:
        print('Number of contours: ', len(contours))
        print('Number of indices0: ', len(indices0), 'indices1: ', len(indices1))
    contours1 = [contours[i] for i in indices1]
    contours1_filtered = [ctr for ctr in contours1 if cv2.contourArea(ctr) > 800*800/4000]
    if debug:
        return contours1_filtered, img
    else:
        return contours1_filtered
imgs = [img1, img3, img5]

plt.figure(figsize=(20,15), dpi=100)
for i,im in enumerate(imgs):
    ctrs, img_resize = calculate_harupan(im, True)
    img_ctrs = cv2.drawContours(img_resize, ctrs, -1, (0,255,0), 2)
    plt.subplot(131+i), plt.imshow(cv2.cvtColor(img_ctrs, cv2.COLOR_BGR2RGB)), plt.xticks([]), plt.yticks([])
plt.show()
Resized to  (1067, 800, 3)
Number of contours:  2514
Number of indices0:  1448 indices1:  875
Resized to  (1067, 800, 3)
Number of contours:  2062
Number of indices0:  1154 indices1:  718
Resized to  (1067, 800, 3)
Number of contours:  1613
Number of indices0:  698 indices1:  795

1つずつ輪郭データを見ていきますが、トラックバーの機能を使うと良さそう。
トラックバー
OpenCVでもトラックバーを出す機能はありますし、他にipywidgetsというものでもできるようです。
- OpenCVのトラックバー
http://labs.eecs.tottori-u.ac.jp/sd/Member/oyamada/OpenCV/html/py_tutorials/py_gui/py_trackbar/py_trackbar.html#trackbar
https://epic-life.me/archives/1363
- ipywidgetsのトラックバー
https://qiita.com/ciela/items/55dc860433d52228ce20
https://qiita.com/ground0state/items/58a576cf09a56a0dd425
jupyter上でやってみましたが、OpenCVのほうはいまいちだったので、ipywidgetsでやった結果を以下に示します。
ひとまずipywidgetsが入っていることの確認。
pip list | grep ipywidgets
STDIN
ipywidgets                         7.5.1
Note: you may need to restart the kernel to use updated packages.
では、ipywidgetsのトラックバーを使ってみます。
ctrs1, img1_resize = calculate_harupan(img1, True)

def drawContour_img1(idx):
    img1_ctr = cv2.drawContours(img1_resize.copy(), [ctrs1[idx]], -1, (0,255,0), 2)
    plt.imshow(cv2.cvtColor(img1_ctr, cv2.COLOR_BGR2RGB)), plt.xticks([]), plt.yticks([])
    plt.show()
Resized to  (1067, 800, 3)
Number of contours:  2514
Number of indices0:  1448 indices1:  875
from ipywidgets import interact
interact(drawContour_img1,idx=(0,len(ctrs1)-1));

いい感じにjupyter上でトラックバーを動かして1つずつ輪郭表示ができています。
キャプチャした動画も。
from IPython.display import Image
Image('blog_OpenCV_31-Jupyter-Notebook-Google-Chrome-2021-12-28-01-42-05_Trim.gif')

テンプレート選択
上で見た中から、文字の種類ごとに1つずつテンプレートを選びます。
Bounding Box(外接矩形)も確認して、画像から切り出してみます。
Bounding Box参考
https://docs.opencv.org/4.5.2/dd/d49/tutorial_py_contour_features.html
ctrs1_idx_zero = 26
ctrs1_idx_one = 27
ctrs1_idx_two = 24
ctrs1_idx_three = 33
ctrs1_idx_five = 35

ctrs1_idx_numbers = [ctrs1_idx_zero, ctrs1_idx_one, ctrs1_idx_two, ctrs1_idx_three, ctrs1_idx_five]
plt.figure(figsize=(20,15), dpi=100)
for i,idx in enumerate(ctrs1_idx_numbers):
    img = cv2.drawContours(img1_resize.copy(), [ctrs1[idx]], -1, (0,255,0), 2)
    x,y,w,h = cv2.boundingRect(ctrs1[idx])
    plt.subplot(2,5,1+i), plt.imshow(cv2.cvtColor(img, cv2.COLOR_BGR2RGB)), plt.xticks([]), plt.yticks([])
    plt.subplot(2,5,6+i), plt.imshow(cv2.cvtColor(img[y:y+h,x:x+w,:], cv2.COLOR_BGR2RGB)), plt.xticks([]), plt.yticks([])
plt.show()

いい感じです。
あと2点やっておきたいのが、
- 回転を考慮した外接矩形を用意、また、輪郭画像の向きをまっすぐに回転させる
- 輪郭内部を塗りつぶしてテンプレートデータとする
というところです。
回転角を考慮した外接矩形
cv2.minAreaRect()関数で用意することができます。
返り値は、(中心座標(x,y), (幅,高さ), 回転角)となるとのこと。
回転角の基準、向きはどうなるのか…
rect1_zero = cv2.minAreaRect(ctrs1[ctrs1_idx_zero])
print(rect1_zero)
center1_zero = rect1_zero[0]
size1_zero = rect1_zero[1]
angle1_zero = rect1_zero[2]
((645.6923828125, 285.5384826660156), (54.07914352416992, 39.194976806640625), 82.87498474121094)
box1_zero = cv2.boxPoints(rect1_zero)
box1_zero = np.int0(box1_zero)
bound1_zero = cv2.boundingRect(box1_zero)
img1_zero = cv2.drawContours(img1_resize.copy(), [box1_zero], -1, (0,255,0), 2)
img1_zero = img1_zero[bound1_zero[1]:bound1_zero[1]+bound1_zero[3], bound1_zero[0]:bound1_zero[0]+bound1_zero[2],:]

plt.figure(figsize=(3,2), dpi=100)
plt.imshow(cv2.cvtColor(img1_zero, cv2.COLOR_BGR2RGB)), plt.xticks([]), plt.yticks([])
plt.show()

この画像を回転してみます。
cv2.getRotationMatrix2D()とcv2.warpAffine()を使います。
https://docs.opencv.org/4.5.2/da/d6e/tutorial_py_geometric_transformations.html
- 一旦Bounding Boxの中心を中心として、外接矩形の角度分回転させます。
- 並進変換を行い、中心が外接矩形(回転考慮あり)の中心座標に来るようにします。
- これら2つの変換を1つの行列で表現し、外接矩形(回転考慮なし)の範囲の画像に適用します。
変換後の画像サイズは外接矩形のサイズにします。
Mrot1_zero = cv2.getRotationMatrix2D((bound1_zero[2]/2.0, bound1_zero[3]/2.0), angle1_zero, 1)
Mrot1_zero[0,2] += (size1_zero[0]-bound1_zero[2])/2.0
Mrot1_zero[1,2] += (size1_zero[1]-bound1_zero[3])/2.0
print(Mrot1_zero)
rot1_zero = cv2.warpAffine(img1_zero, Mrot1_zero, np.int0(size1_zero))
plt.figure(figsize=(3,2), dpi=100)
plt.imshow(cv2.cvtColor(rot1_zero, cv2.COLOR_BGR2RGB)), plt.xticks([]), plt.yticks([])
plt.show()
[[ 0.12403472  0.99227788 -5.14744149]
 [-0.99227788  0.12403472 39.25699445]]

まあまあ思ったような感じで回転できました。
他の文字も外接矩形の算出と回転をやってみます。
def align_and_clip_image(img, ctr):
    rect = cv2.minAreaRect(ctr)
    center = rect[0]
    size = rect[1]
    angle = rect[2]
    box = cv2.boxPoints(rect)
    box = np.int0(box)
    bound = cv2.boundingRect(box)
    img_clip = cv2.drawContours(img.copy(), [ctr], -1, (0,255,0),2)
    img_clip = img_clip[bound[1]:bound[1]+bound[3], bound[0]:bound[0]+bound[2],:]
    M = cv2.getRotationMatrix2D((bound[2]/2.0, bound[3]/2.0), angle, 1)
    M[0,2] += (size[0]-bound[2])/2.0
    M[1,2] += (size[1]-bound[3])/2.0
    img_clip = cv2.warpAffine(img_clip, M, np.int0(size))
    return img_clip
plt.figure(figsize=(20,15), dpi=100)
for i,idx in enumerate(ctrs1_idx_numbers):
    img = align_and_clip_image(img1_resize, ctrs1[idx])
    plt.subplot(1,5,1+i), plt.imshow(cv2.cvtColor(img, cv2.COLOR_BGR2RGB)), plt.xticks([]), plt.yticks([])
plt.show()

いずれもそれなりにまっすぐになっていますが、矩形の向きの定義がどうなるのかやはり不明です。
0,90,180,270°の4つの回転パターンが出てきそうなので、テンプレートマッチングするときにも4パターンの比較をするのがよさそうかと思います。
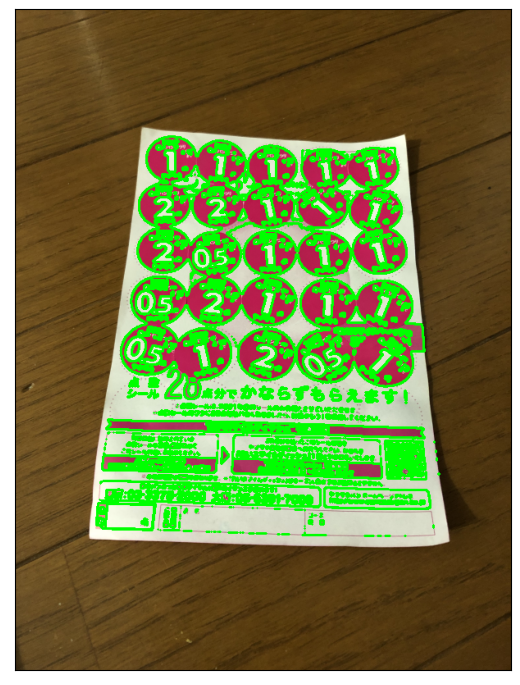
輪郭内部の塗りつぶし
cv2.drawContours()で輪郭描画するときに、thickness(線分太さ)引数に負の値を入れると輪郭内部の塗りつぶしになるようです。
上で表示した3画像で確認してみます。
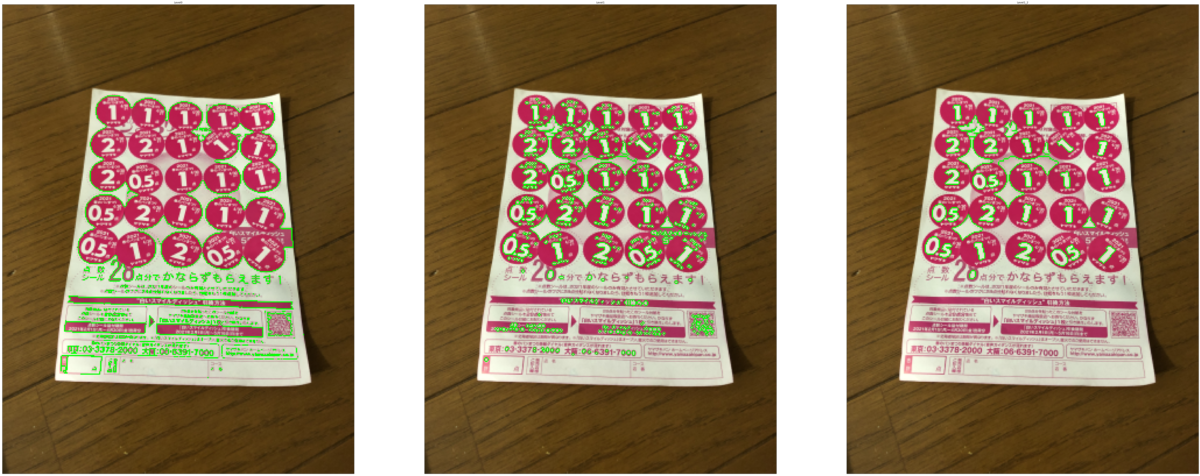
imgs = [img1, img3, img5]

plt.figure(figsize=(20,15), dpi=100)
for i,im in enumerate(imgs):
    ctrs, img_resize = calculate_harupan(im, True)
    # thickness for cv2.drawContours() is -1
    img_ctrs = cv2.drawContours(img_resize, ctrs, -1, (0,255,0), -1)
    plt.subplot(131+i), plt.imshow(cv2.cvtColor(img_ctrs, cv2.COLOR_BGR2RGB)), plt.xticks([]), plt.yticks([])
plt.show()
Resized to  (1067, 800, 3)
Number of contours:  2514
Number of indices0:  1448 indices1:  875
Resized to  (1067, 800, 3)
Number of contours:  2062
Number of indices0:  1154 indices1:  718
Resized to  (1067, 800, 3)
Number of contours:  1613
Number of indices0:  698 indices1:  795

確かに塗りつぶしされています。
1つ目の画像で選んだ文字輪郭でもやってみます。
plt.figure(figsize=(20,15), dpi=100)
for i,idx in enumerate(ctrs1_idx_numbers):
    # thickness for cv2.drawContours() is -1
    img = cv2.drawContours(img1_resize.copy(), [ctrs1[idx]], -1, (0,255,0), -1)
    x,y,w,h = cv2.boundingRect(ctrs1[idx])
    plt.subplot(2,5,1+i), plt.imshow(cv2.cvtColor(img, cv2.COLOR_BGR2RGB)), plt.xticks([]), plt.yticks([])
    plt.subplot(2,5,6+i), plt.imshow(cv2.cvtColor(img[y:y+h,x:x+w,:], cv2.COLOR_BGR2RGB)), plt.xticks([]), plt.yticks([])
plt.show()

いい感じです。
テンプレート画像作成
今までやったところから、テンプレート画像を作ってみたいと思います。
- 輪郭を選ぶ
- 輪郭の外接矩形のサイズで黒画像を作る
- 黒画像上に輪郭を塗りつぶしで描画
- この画像を回転させる
という手順になります。
輪郭描画のときに、必要なだけのサイズの画像を対象としようと思うので、輪郭データの座標をいじる必要があります。
これを確認します。
まずは輪郭データの構造から。
type(ctrs1)
list
type(ctrs1[ctrs1_idx_zero])
numpy.ndarray
ctrs1[ctrs1_idx_zero].shape
(62, 1, 2)
ctrs1[ctrs1_idx_zero][0:10,:,:]
array([[[639, 260]],

       [[640, 259]],

       [[647, 259]],

       [[648, 260]],

       [[650, 260]],

       [[651, 261]],

       [[652, 261]],

       [[659, 268]],

       [[659, 269]],

       [[661, 271]]], dtype=int32)
点の座標は、(水平座標, 垂直座標)でよさそうです。
輪郭の外接矩形の原点を引けば、外接矩形内の座標が出せます。
ctrs1[ctrs1_idx_zero][0:10,:,:] - bound1_zero[0:2]
array([[[17,  4]],

       [[18,  3]],

       [[25,  3]],

       [[26,  4]],

       [[28,  4]],

       [[29,  5]],

       [[30,  5]],

       [[37, 12]],

       [[37, 13]],

       [[39, 15]]])
では、テンプレート画像生成の処理を書いてみます。
また、1つ目の画像に適用してみます。
def create_template(img, ctr):
    rect = cv2.minAreaRect(ctr)
    center = rect[0]
    size = rect[1]
    angle = rect[2]
    box = cv2.boxPoints(rect)
    box = np.int0(box)
    bound = cv2.boundingRect(box)
    img_template = np.zeros((bound[3],bound[2]), 'uint8')
    ctr = ctr - bound[0:2]
    img_template = cv2.drawContours(img_template, [ctr], -1, 255,-1)
    M = cv2.getRotationMatrix2D((bound[2]/2.0, bound[3]/2.0), angle, 1)
    M[0,2] += (size[0]-bound[2])/2.0
    M[1,2] += (size[1]-bound[3])/2.0
    img_template = cv2.warpAffine(img_template, M, np.int0(size))
    return img_template
plt.figure(figsize=(20,15), dpi=100)
for i,idx in enumerate(ctrs1_idx_numbers):
    img = create_template(img1_resize, ctrs1[idx])
    plt.subplot(1,5,1+i), plt.imshow(img, cmap='gray'), plt.xticks([]), plt.yticks([])
plt.show()

結果良好。
ということで、残りの2画像についてもテンプレートの選択、テンプレート画像の作成をやってみます。
ctrs3, img3_resize = calculate_harupan(img3, True)

def drawContour_img3(idx):
    img3_ctr = cv2.drawContours(img3_resize.copy(), [ctrs3[idx]], -1, (0,255,0), 2)
    plt.imshow(cv2.cvtColor(img3_ctr, cv2.COLOR_BGR2RGB)), plt.xticks([]), plt.yticks([])
    plt.show()
Resized to  (1067, 800, 3)
Number of contours:  2062
Number of indices0:  1154 indices1:  718
interact(drawContour_img3,idx=(0,len(ctrs3)-1));

ctrs3_idx_zero = 7
ctrs3_idx_one = 4
ctrs3_idx_two = 17
ctrs3_idx_five = 6
ctrs3_idx_numbers = [ctrs3_idx_zero, ctrs3_idx_one, ctrs3_idx_two, ctrs3_idx_five]
plt.figure(figsize=(20,15), dpi=100)
for i,idx in enumerate(ctrs3_idx_numbers):
    img = create_template(img3_resize, ctrs3[idx])
    plt.subplot(1,4,1+i), plt.imshow(img, cmap='gray'), plt.xticks([]), plt.yticks([])
plt.show()

ctrs5, img5_resize = calculate_harupan(img5, True)

def drawContour_img5(idx):
    img5_ctr = cv2.drawContours(img5_resize.copy(), [ctrs5[idx]], -1, (0,255,0), 2)
    plt.imshow(cv2.cvtColor(img5_ctr, cv2.COLOR_BGR2RGB)), plt.xticks([]), plt.yticks([])
    plt.show()
Resized to  (1067, 800, 3)
Number of contours:  1613
Number of indices0:  698 indices1:  795
interact(drawContour_img5,idx=(0,len(ctrs5)-1));

ctrs5_idx_zero = 3
ctrs5_idx_one = 4
ctrs5_idx_one_2 = 8
ctrs5_idx_two = 2
ctrs5_idx_five = 5
ctrs5_idx_numbers = [ctrs5_idx_zero, ctrs5_idx_one, ctrs5_idx_one_2, ctrs5_idx_two, ctrs5_idx_five]
plt.figure(figsize=(20,15), dpi=100)
for i,idx in enumerate(ctrs5_idx_numbers):
    img = create_template(img5_resize, ctrs5[idx])
    plt.subplot(1,5,1+i), plt.imshow(img, cmap='gray'), plt.xticks([]), plt.yticks([])
plt.show()

いずれもいい結果になっています。
5番目画像では、'1'の文字について、傾いているものとまっすぐのものでテンプレートを作ってみましたが、ほぼ同じ結果が得られています。
どの年も少しずつ点数文字のフォントが違うみたいです。
今やっている結果から、来年の春のパン祭りで使えるツールを作ってみたいですが、そのときは改めてテンプレート作成をする必要があるかと。
以上
今回はここまでです。
次回は、実際にテンプレートマッチングをやってみたいと思います。